Alcoa Corp AA
Revenue Intelligence Report • 40 quarters of SEC filing data • Updated 2026-03-15
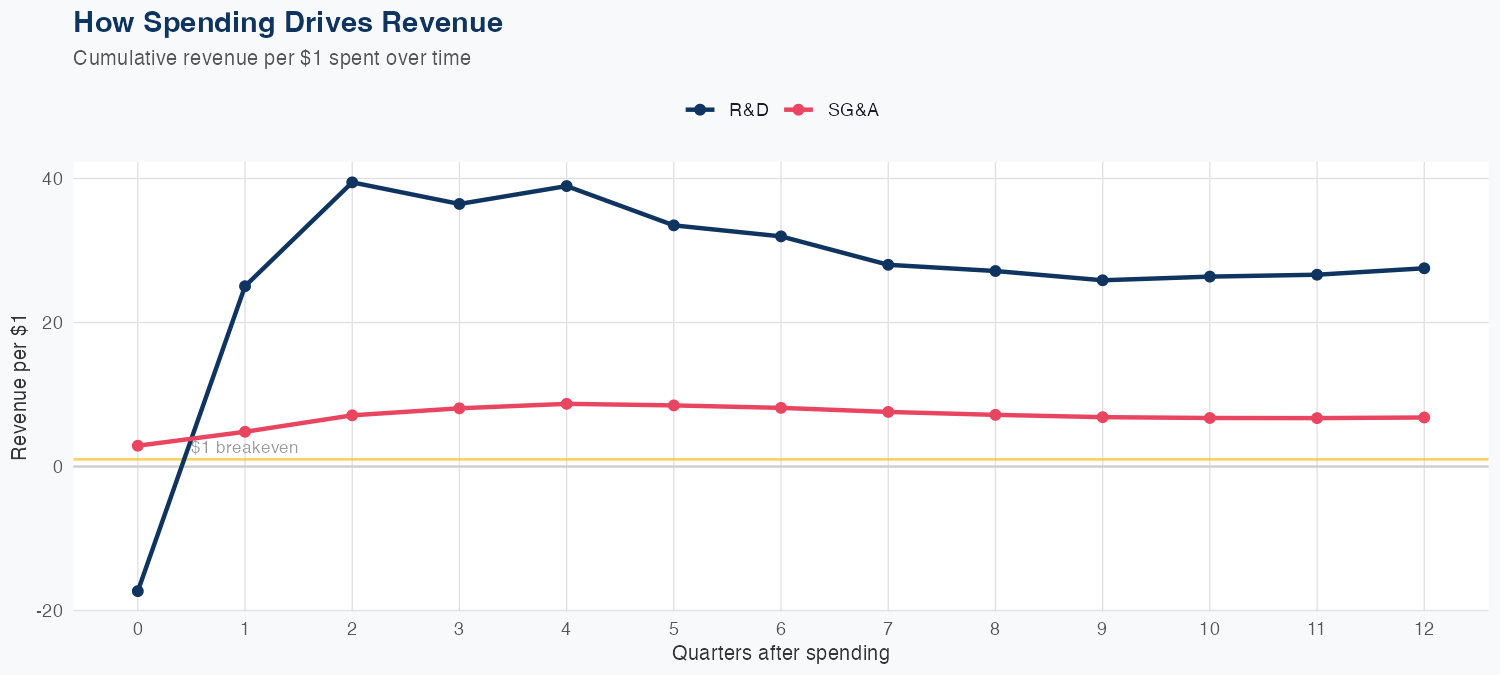
Revenue is driven by exceptionally high leverage from R&D spending, with long-run revenue multipliers of $27.53 per $1 of R&D and $6.81 per $1 of SG&A, highlighting R&D as the primary growth engine and SG&A as a meaningful but smaller contributor. The latest quarter posted $3.449B in revenue, underscoring the company’s scale, while the model’s overall accuracy is 5.6% MAPE. However, a holdout test showed a 15.6% error (predicted $2.9B vs actual $3.4B), signaling meaningful near-term forecasting uncertainty. The FY revenue forecast is about $12B, down 3.9% year over year, suggesting softer top-line momentum even as disciplined R&D investment could support longer-term growth.
Investment Thesis
The econometric model achieves strong accuracy (5.6% MAPE), suggesting Alcoa Corp's revenue trajectory is well-characterized by its spending patterns. Every $1 of R&D investment is associated with $27.53 of revenue, indicating efficient capital deployment in innovation. Each $1 of SG&A spending generates $6.81 in revenue, reflecting strong commercial efficiency.
Revenue Forecast
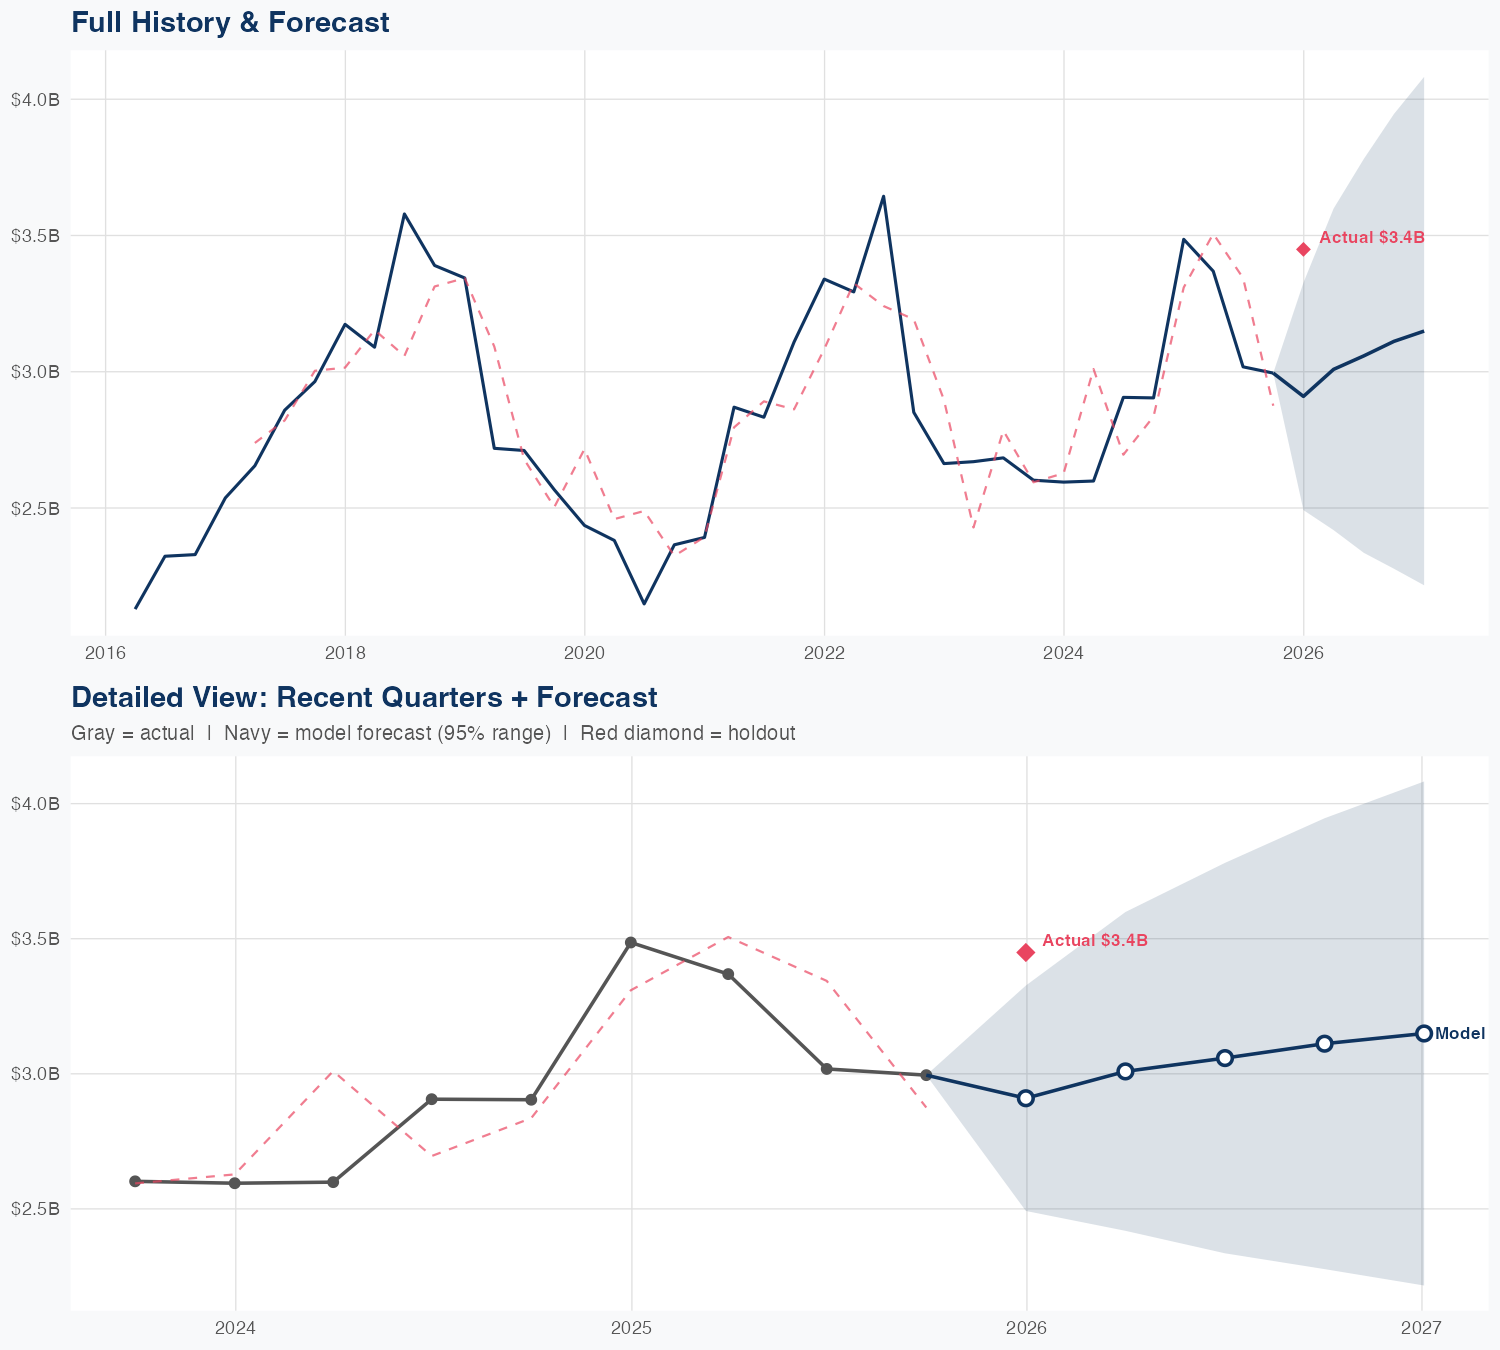
Quarterly Detail
| Quarter | Model Forecast | Actual | 95% Range | YoY Growth | Status |
|---|---|---|---|---|---|
| Q4 2025 | $2.9B | $3.4B | $2.5B – $3.3B | -16.5% | ✗ Outside range |
| Q2 2026 | $3.0B | $2.4B – $3.6B | -10.7% | ||
| Q3 2026 | $3.1B | $2.3B – $3.8B | +1.3% | ||
| Q4 2026 | $3.1B | $2.3B – $3.9B | +3.9% | ||
| Q1 2027 | $3.1B | $2.2B – $4.1B | -8.7% |
Seasonal Factors
| Fiscal Quarter | Seasonal Factor | vs Trend | Interpretation | Obs. |
|---|---|---|---|---|
| FQ1 (Sep–Nov) | 1.0233 | +2.3% | In line with trend | 9 |
| FQ2 (Dec–Feb) | 1.0001 | +0.0% | In line with trend | 9 |
| FQ3 (Mar–May) | 0.9694 | -3.1% | -3.1% below trend | 9 |
| FQ4 (Jun–Aug) | 1.012 | +1.2% | In line with trend | 9 |
How Spending Drives Revenue
Want this analysis for your portfolio?
I build custom revenue intelligence reports for investors and companies using SEC filing data, econometric modeling, and AI-powered insights.
Get in Touch