American Airlines Group Inc. AAL
Revenue Intelligence Report • 52 quarters of SEC filing data • Updated 2026-03-15
Revenue outlook: American Airlines is forecast to generate about $54.0 billion in FY revenue, roughly flat to a 1% decline year over year, with the trajectory modestly improving as structural/platform growth compounds with SG&A investments. Our econometric model shows structural/platform growth contributing about 37% of revenue growth and SG&A spending contributing the remaining 63%, implying the near-term topline is increasingly driven by investment spend. Binding constraint: fleet and crew capacity—the airline's ability to operate additional flights and deploy more seats—is the key bottleneck that will determine how much incremental SG&A spend can translate into revenue growth. The SG&A revenue multiplier has risen over time, indicating spending is becoming more productive, albeit within capacity limits. Key risk: any sustained capacity constraints or disruptions—aircraft availability, crew scheduling, or airport slots—could cap upside and keep revenue declines larger than expected.
Investment Thesis
At 15.7% MAPE, the model captures American Airlines Group Inc.'s broad revenue trajectory, though quarterly variability suggests sensitivity to external factors. Each $1 of SG&A spending generates $1.11 in revenue, reflecting strong commercial efficiency.
Revenue Forecast
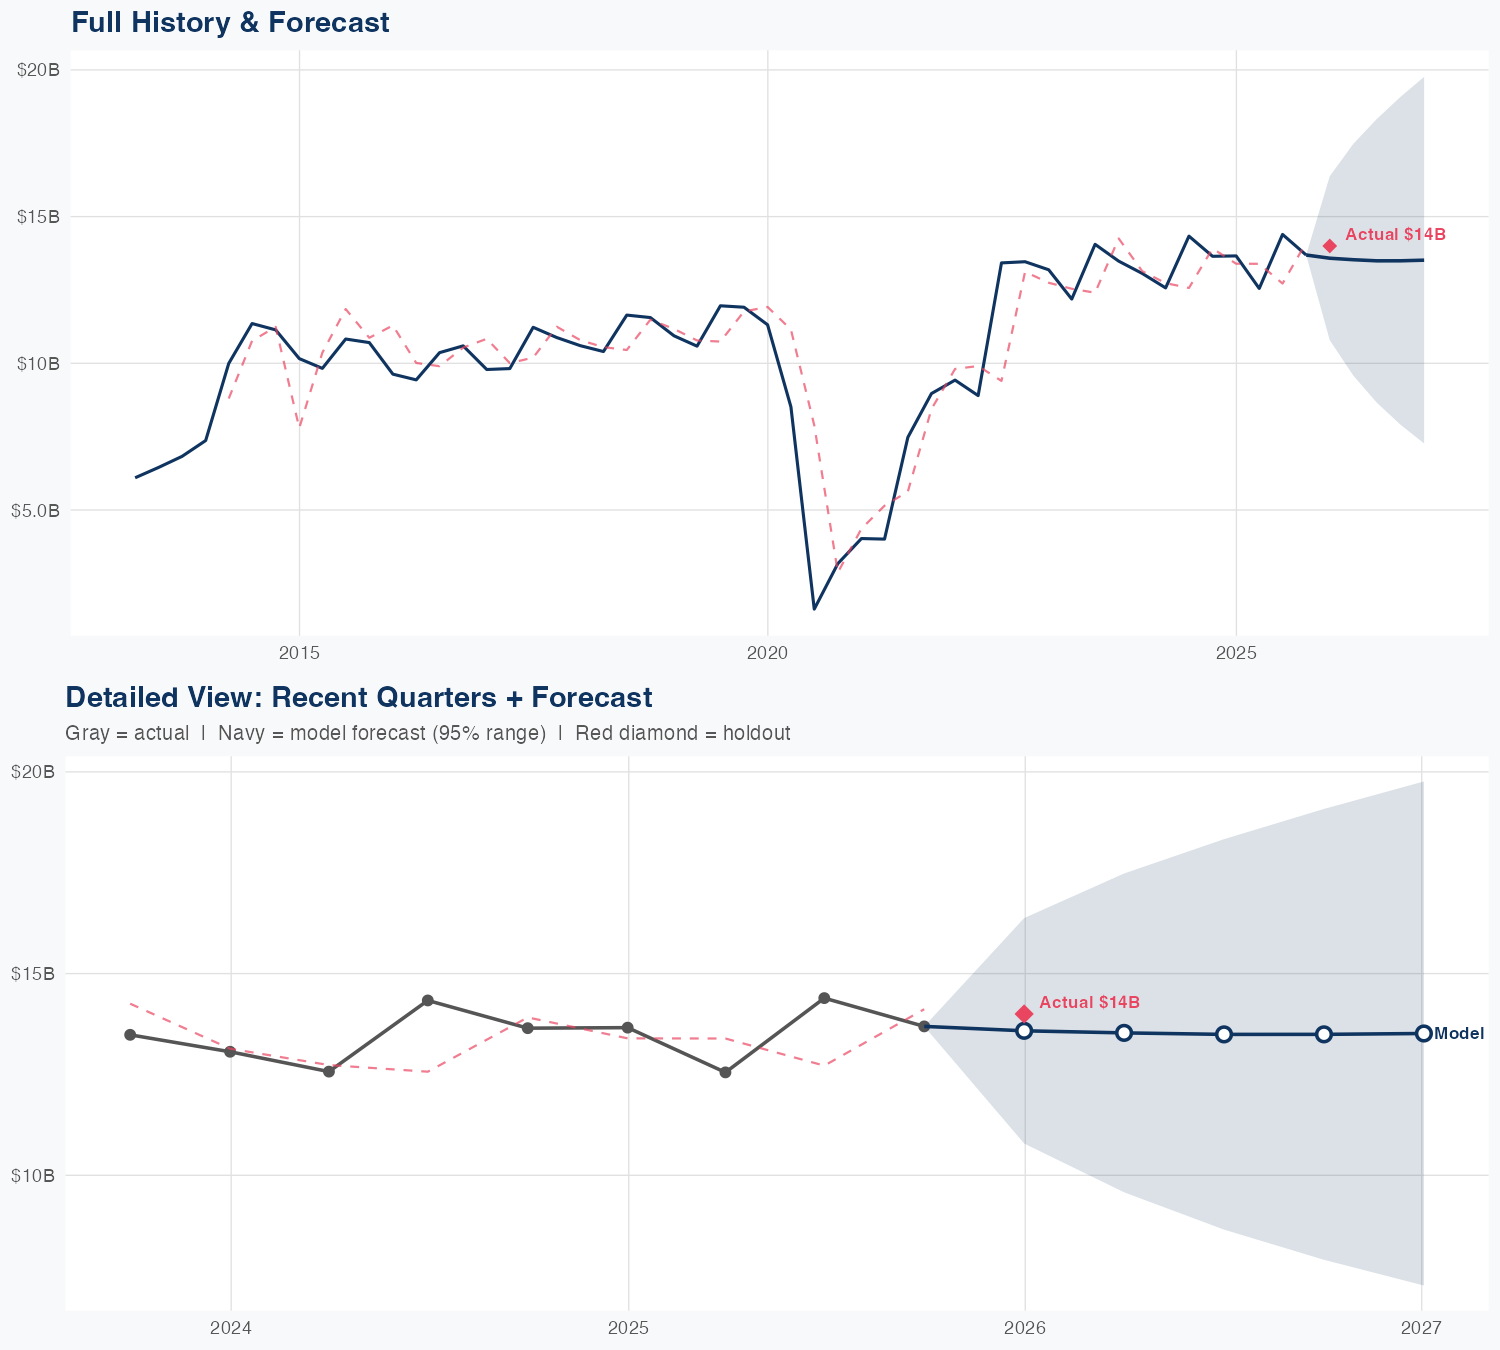
Quarterly Detail
| Quarter | Model Forecast | Actual | 95% Range | YoY Growth | Status |
|---|---|---|---|---|---|
| Q4 2025 | $14B | $14B | $11B – $16B | -1.2% | ✓ In range |
| Q2 2026 | $13B | $9.5B – $17B | +7.0% | ||
| Q3 2026 | $14B | $8.7B – $18B | -6.0% | ||
| Q4 2026 | $14B | $8.0B – $19B | -0.8% | ||
| Q1 2027 | $14B | $7.3B – $20B | -3.4% |
Seasonal Factors
| Fiscal Quarter | Seasonal Factor | vs Trend | Interpretation | Obs. |
|---|---|---|---|---|
| FQ1 (Sep–Nov) | 1.0056 | +0.6% | In line with trend | 12 |
| FQ2 (Dec–Feb) | 0.9826 | -1.7% | In line with trend | 12 |
| FQ3 (Mar–May) | 0.972 | -2.8% | In line with trend | 12 |
| FQ4 (Jun–Aug) | 1.1138 | +11.4% | +11.4% above trend | 12 |
How Spending Drives Revenue
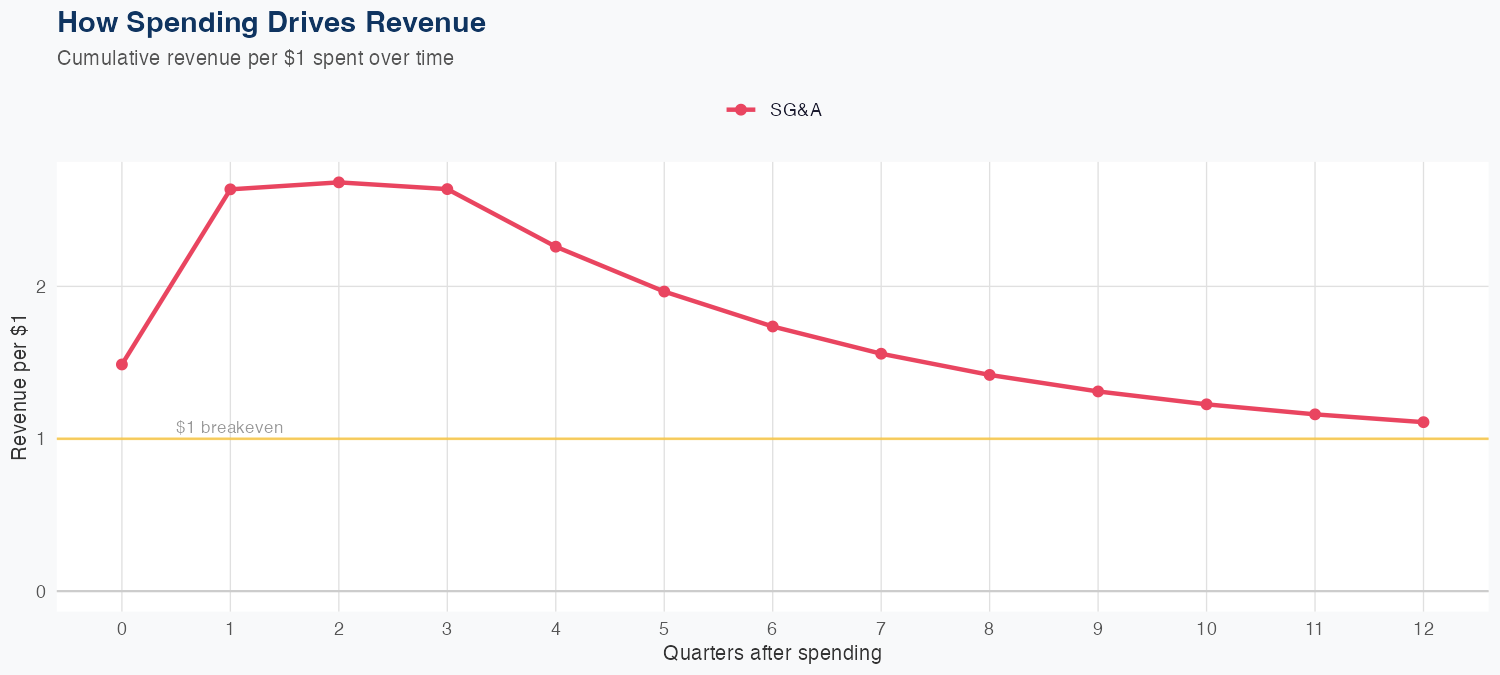
Spending Efficiency Over Time
Current SG&A multiplier: 7.0145
Want this analysis for your portfolio?
I build custom revenue intelligence reports for investors and companies using SEC filing data, econometric modeling, and AI-powered insights.
Get in Touch