Apple Inc. AAPL
Revenue Intelligence Report • 53 quarters of SEC filing data • Updated 2026-03-16
Apple's revenue is expected to grow about 0.5% year over year, with momentum anchored in services and platform growth while hardware expansion remains modest. The binding constraint on revenue growth appears to be delivery capacity in hardware fulfillment—manufacturing and logistics limits that could cap upside from higher SG&A investment. Our econometric model shows SG&A spending is the dominant growth lever and its elasticity is rising, meaning incremental marketing and selling expense tends to lift topline more than before. R&D remains a smaller, near-neutral driver, while structural platform growth provides support but is not the binding constraint. Key risk: any material disruption to supply chains or bottlenecks in product fulfillment could prevent SG&A-driven demand from translating into higher revenue.
Investment Thesis
The econometric model achieves strong accuracy (4.6% MAPE), suggesting Apple Inc.'s revenue trajectory is well-characterized by its spending patterns. R&D spending currently shows a negative elasticity (-0.12x), which can indicate heavy investment in long-cycle initiatives not yet reflected in revenue. Sales & marketing spend shows a 1.54x elasticity, suggesting effective go-to-market execution.
Revenue Forecast
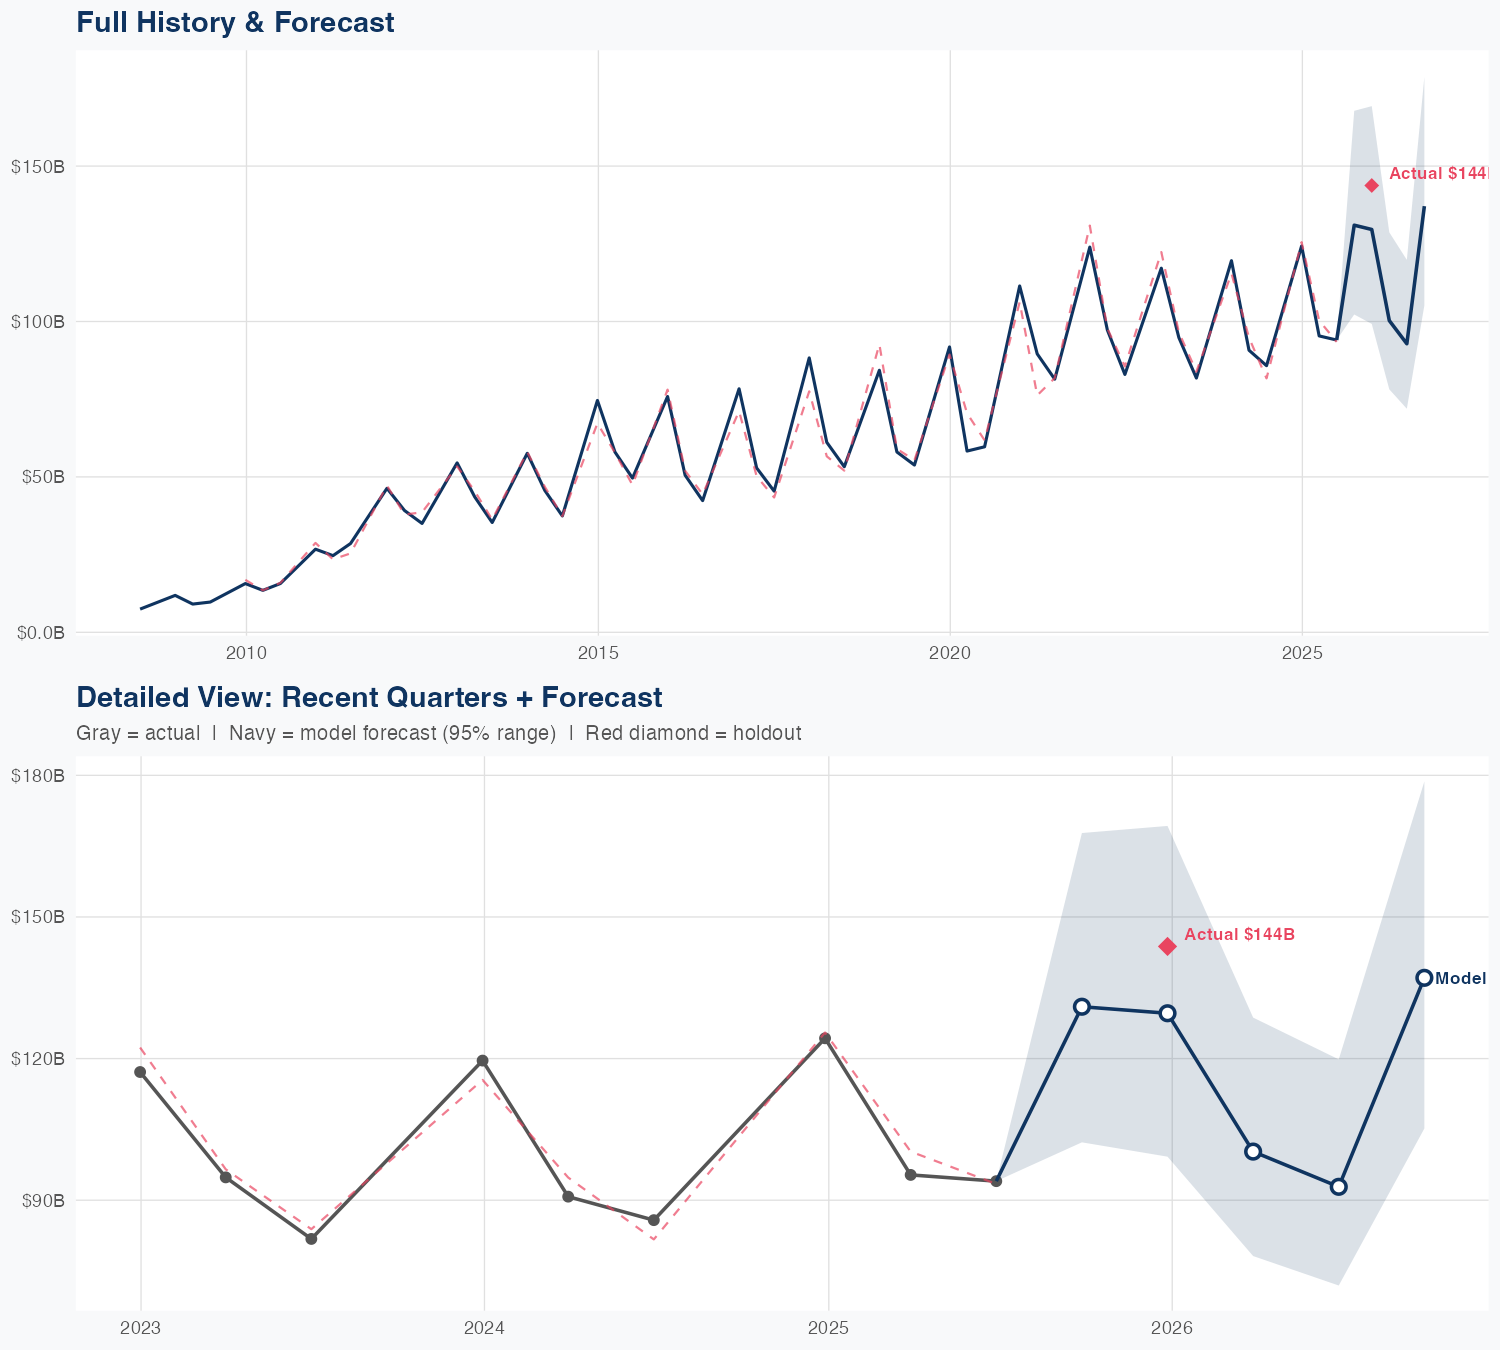
Quarterly Detail
| Quarter | Model Forecast | Actual | 95% Range | YoY Growth | Status |
|---|---|---|---|---|---|
| Q3 2025 | $131B | $144B | $102B – $168B | +52.7% | ✓ In range |
| Q4 2025 | $130B | $99B – $169B | +4.3% | ||
| Q1 2026 | $100B | $78B – $129B | +5.2% | ||
| Q2 2026 | $93B | $72B – $120B | -1.3% | ||
| Q3 2026 | $137B | $105B – $179B | -4.6% |
Seasonal Factors
| Fiscal Quarter | Seasonal Factor | vs Trend | Interpretation | Obs. |
|---|---|---|---|---|
| FQ1 (Sep–Nov) | 1.0 | +0.0% | In line with trend | 0 |
| FQ2 (Dec–Feb) | 0.9921 | -0.8% | In line with trend | 17 |
| FQ3 (Mar–May) | 0.995 | -0.5% | In line with trend | 16 |
| FQ4 (Jun–Aug) | 0.9955 | -0.5% | In line with trend | 16 |
How Spending Drives Revenue
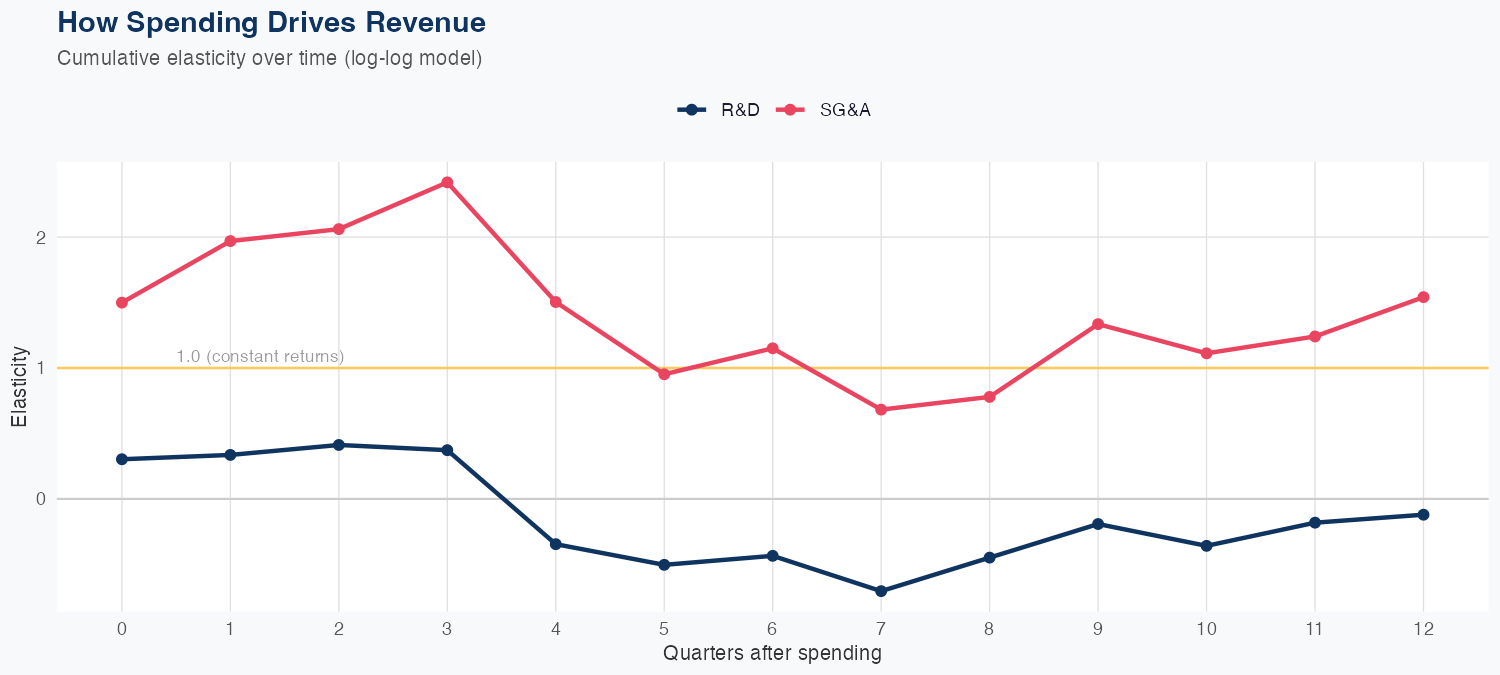
Spending Efficiency Over Time
Current SG&A elasticity: 3.3846x • R&D: 0.0769x
Want this analysis for your portfolio?
I build custom revenue intelligence reports for investors and companies using SEC filing data, econometric modeling, and AI-powered insights.
Get in Touch