American Electric Power Company, Inc. AEP
Revenue Intelligence Report • 65 quarters of SEC filing data • Updated 2026-03-15
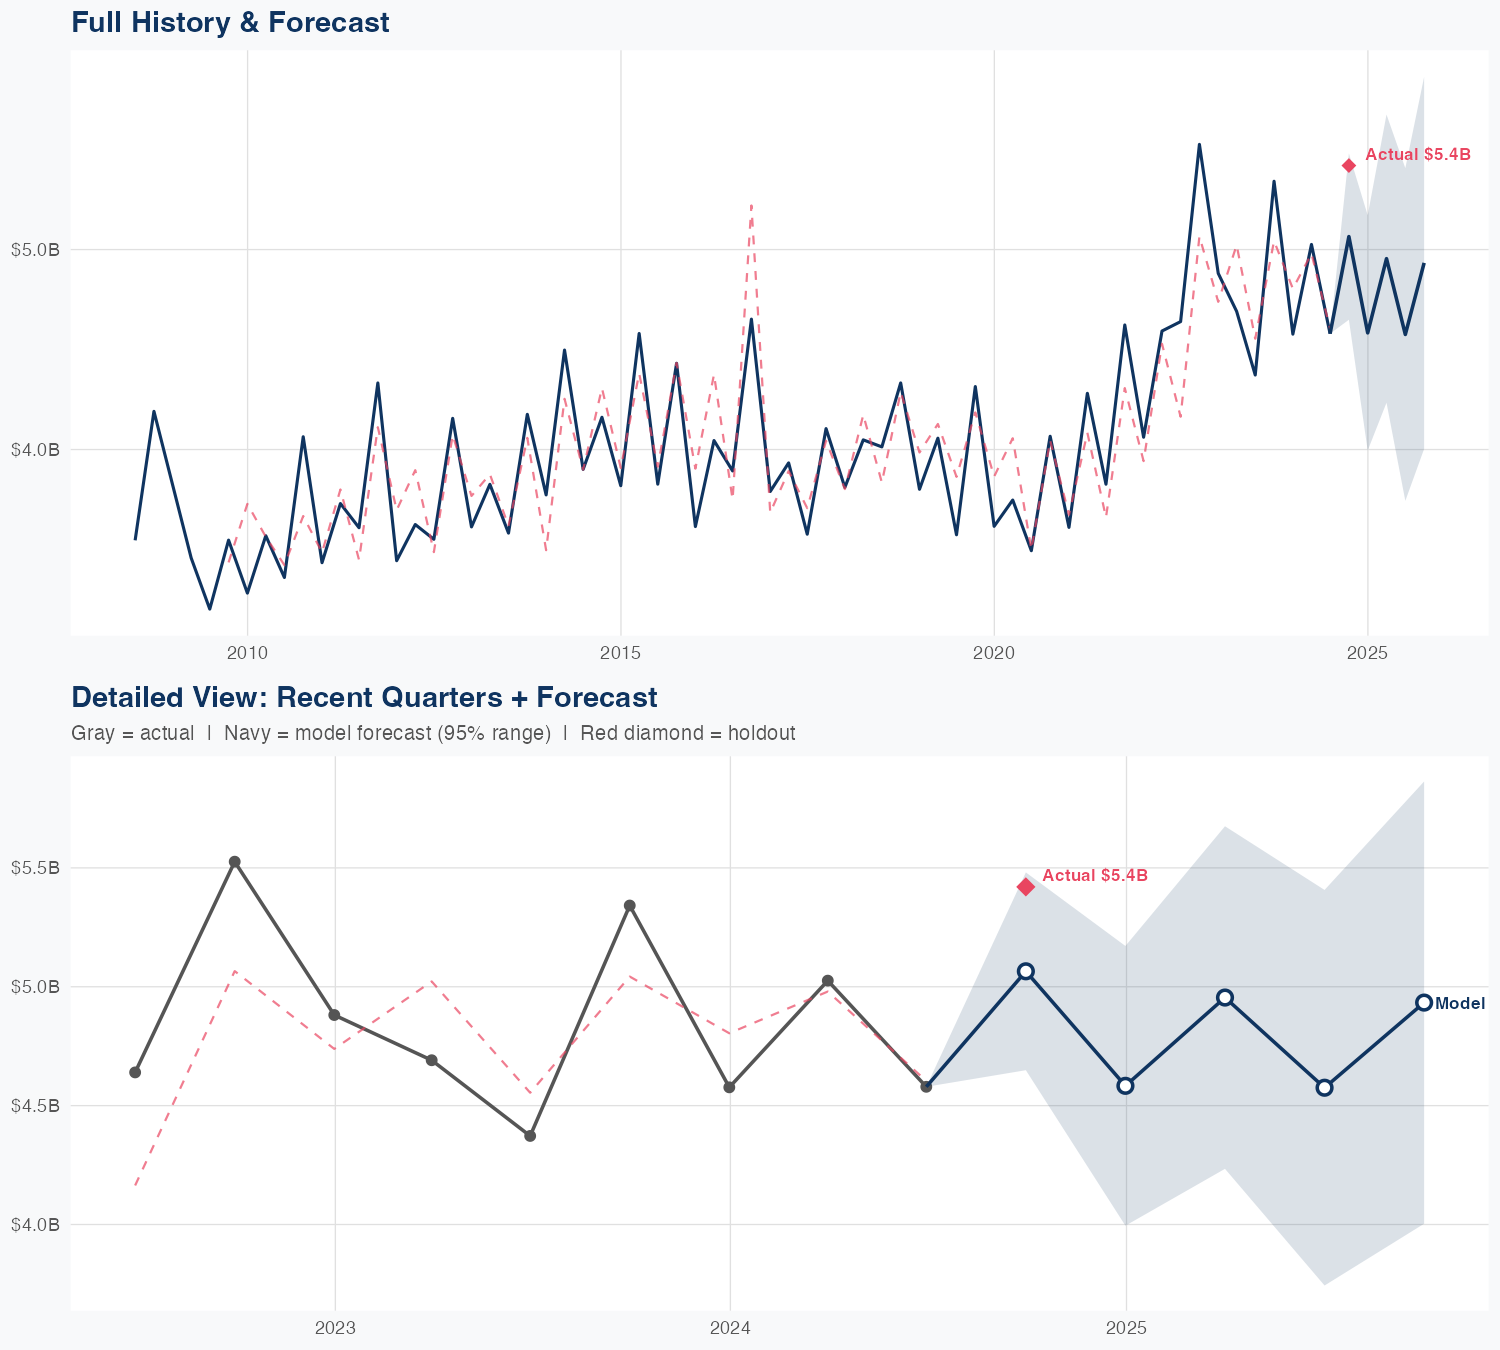
We forecast FY revenue for American Electric Power at about $19.4 billion, down roughly 0.5% year over year, signaling a modestly shrinking topline in the near term. Binding constraint: regulatory rate-case approvals that allow recovery of SG&A-driven investments; our econometric model shows SG&A spending is the dominant growth lever and its impact is rising. As elasticities are high and improving, incremental SG&A spend translates into outsized topline gains when regulators permit cost recovery. Key risk: regulatory timing and outcomes could constrain price increases or cost recovery, capping upside from SG&A-driven growth.
Investment Thesis
The econometric model achieves strong accuracy (4.1% MAPE), suggesting American Electric Power Company, Inc.'s revenue trajectory is well-characterized by its spending patterns. Each $1 of SG&A spending generates $0.36 in revenue, reflecting strong commercial efficiency.
Revenue Forecast
Quarterly Detail
| Quarter | Model Forecast | Actual | 95% Range | YoY Growth | Status |
|---|---|---|---|---|---|
| Q3 2024 | $5.1B | $5.4B | $4.7B – $5.5B | -4.0% | ✓ In range |
| Q4 2024 | $4.7B | $4.1B – $5.2B | +1.7% | ||
| Q2 2025 | $5.0B | $4.3B – $5.7B | -0.0% | ||
| Q3 2025 | $4.7B | $3.8B – $5.5B | +2.2% | ||
| Q4 2025 | $5.1B | $4.2B – $6.1B | -5.3% |
Seasonal Factors
| Fiscal Quarter | Seasonal Factor | vs Trend | Interpretation | Obs. |
|---|---|---|---|---|
| FQ1 (Sep–Nov) | 1.0309 | +3.1% | +3.1% above trend | 16 |
| FQ2 (Dec–Feb) | 0.9773 | -2.3% | In line with trend | 15 |
| FQ3 (Mar–May) | 0.987 | -1.3% | In line with trend | 15 |
| FQ4 (Jun–Aug) | 0.9985 | -0.1% | In line with trend | 15 |
How Spending Drives Revenue
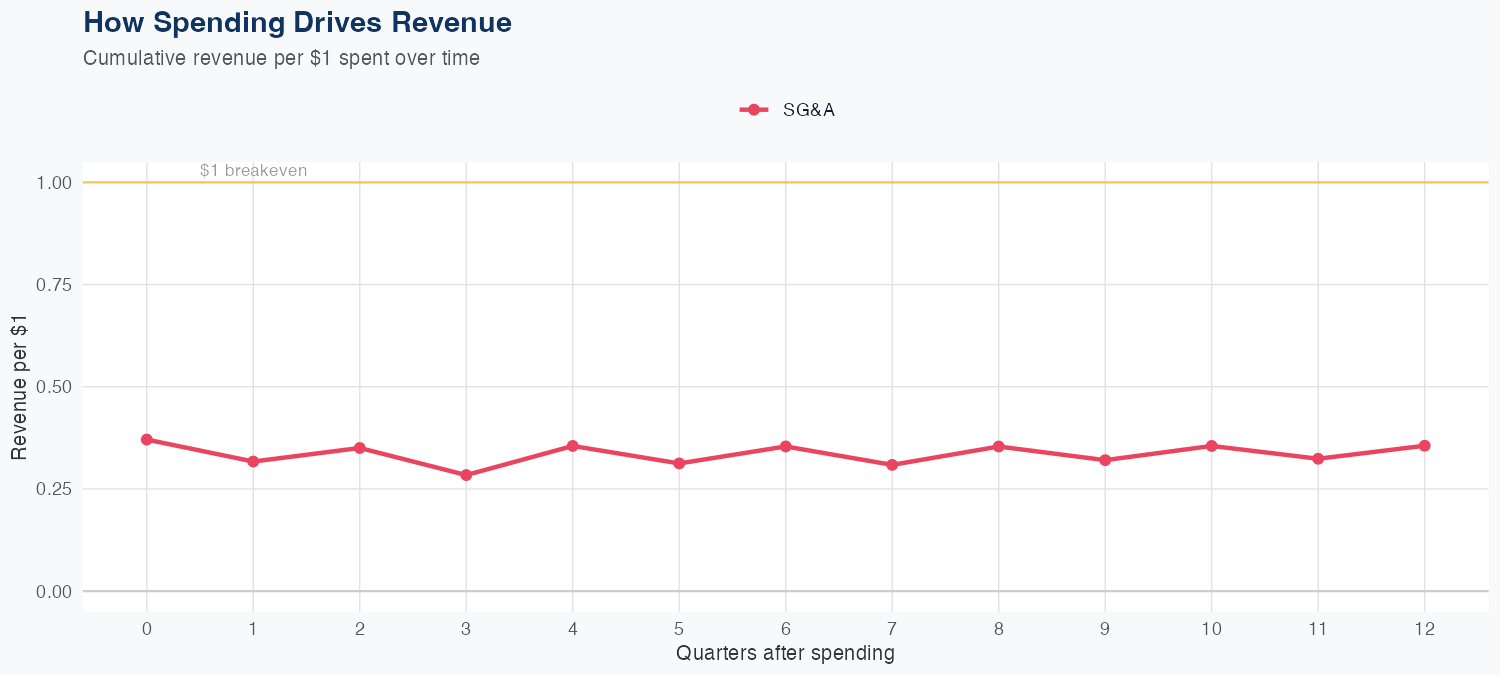
Spending Efficiency Over Time
Current SG&A multiplier: 0.6787
Want this analysis for your portfolio?
I build custom revenue intelligence reports for investors and companies using SEC filing data, econometric modeling, and AI-powered insights.
Get in Touch