Affirm Holdings, Inc. AFRM
Revenue Intelligence Report • 19 quarters of SEC filing data • Updated 2026-03-15
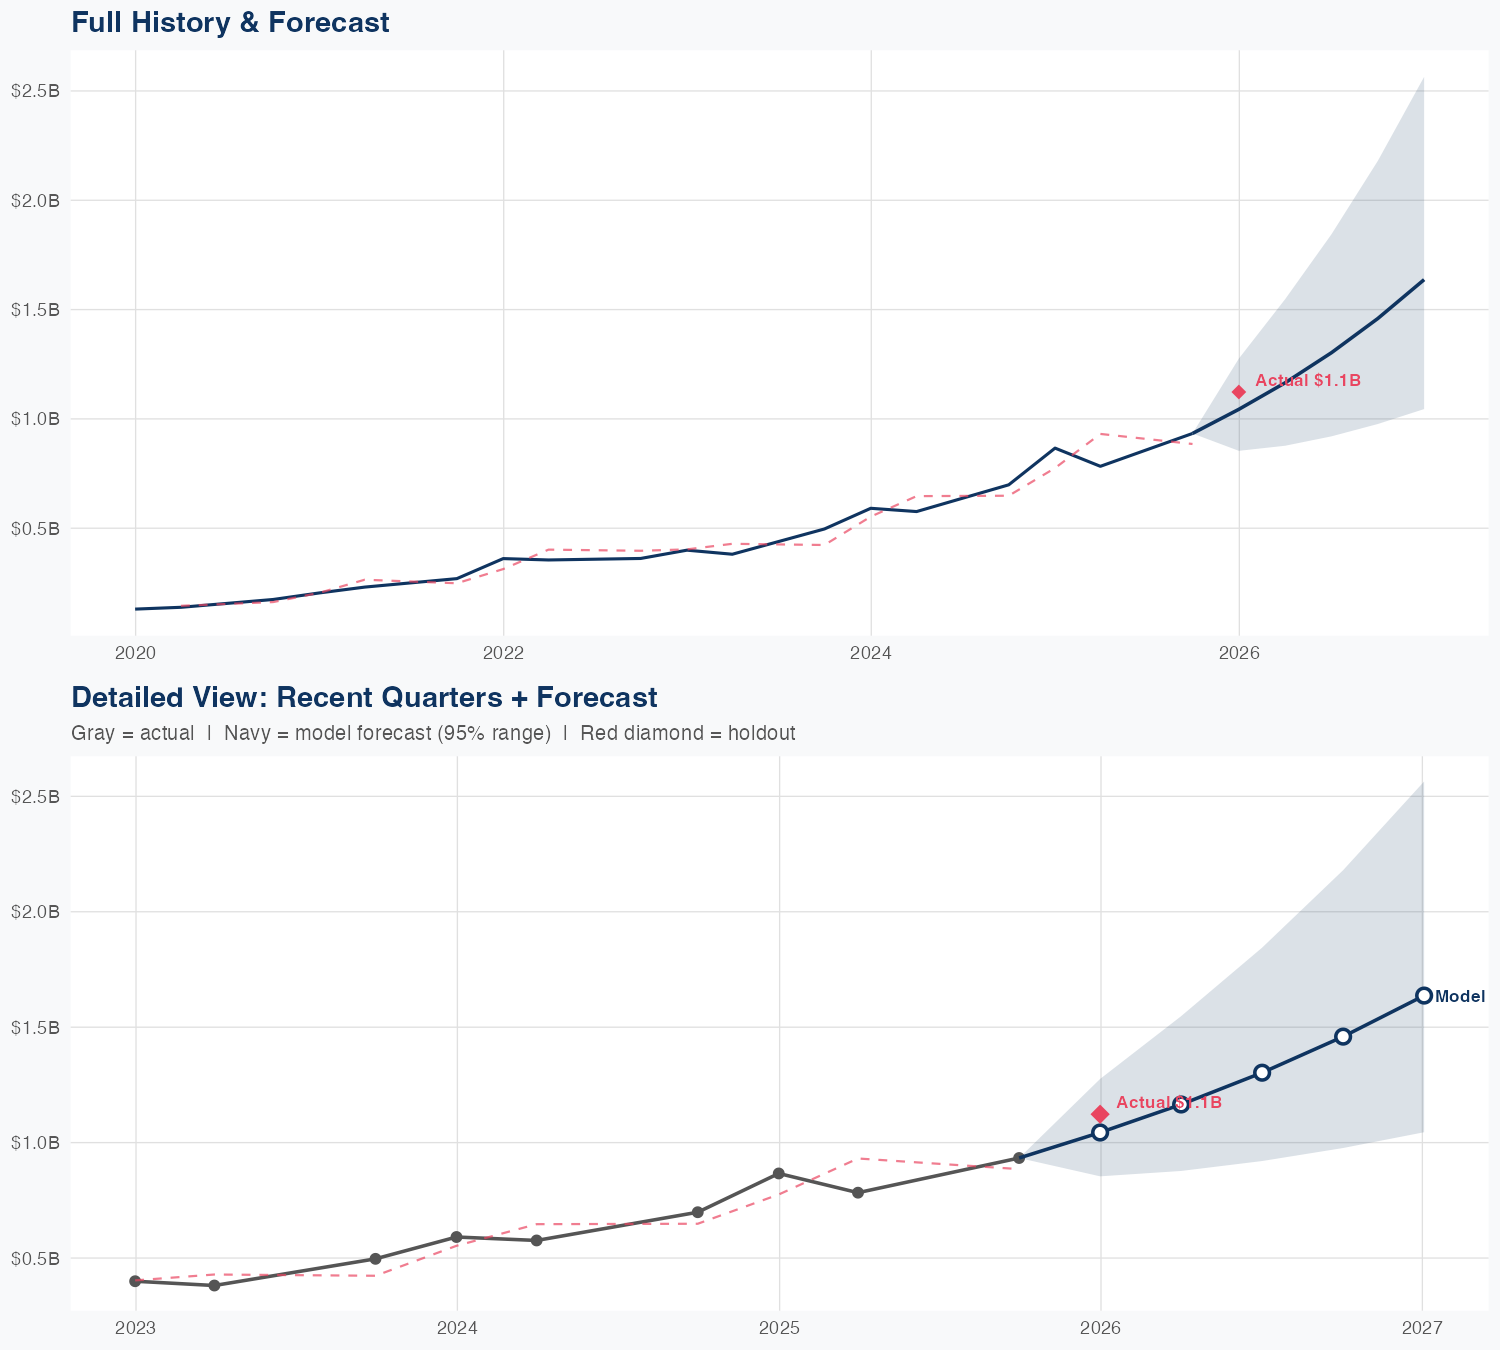
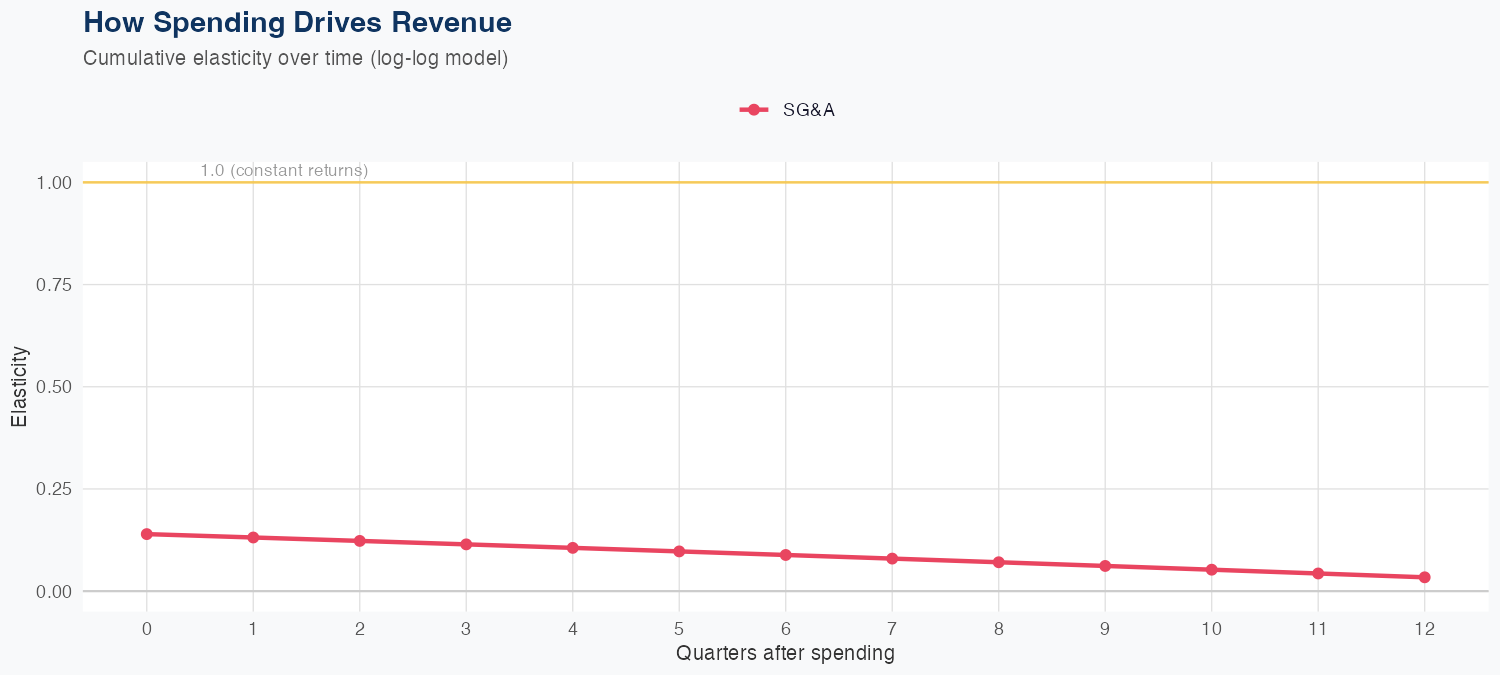
Revenue is driven by underlying demand and activity, but the elasticity of revenue to SG&A is very low: a 1% increase in SG&A corresponds to only a 0.03% revenue gain, implying limited ROI from SG&A spending. The model is a log-log specification with a 9.2% MAPE, and a holdout test showed a predicted 1.0B vs actual 1.1B, a 7.1% error, indicating moderate forecast accuracy. Quarterly revenue was 1.123B, and the full-year forecast of 5.6B implies about 50.1% year-over-year growth. Overall, the outlook remains robust on top-line growth, but prioritizing efficiency over SG&A spend will be crucial given the limited revenue responsiveness to SG&A.
Investment Thesis
At 9.2% MAPE, the model captures Affirm Holdings, Inc.'s broad revenue trajectory, though quarterly variability suggests sensitivity to external factors. Sales & marketing spend shows a 0.03x elasticity, suggesting effective go-to-market execution.
Revenue Forecast
Quarterly Detail
| Quarter | Model Forecast | Actual | 95% Range | YoY Growth | Status |
|---|---|---|---|---|---|
| Q4 2025 | $1.0B | $1.1B | $0.9B – $1.3B | +49.4% | ✓ In range |
| Q2 2026 | $1.2B | $0.9B – $1.5B | +34.5% | ||
| Q3 2026 | $1.3B | $0.9B – $1.8B | +66.4% | ||
| Q4 2026 | $1.5B | $1.0B – $2.2B | +56.3% | ||
| Q1 2027 | $1.6B | $1.0B – $2.6B | +45.8% |
Seasonal Factors
| Fiscal Quarter | Seasonal Factor | vs Trend | Interpretation | Obs. |
|---|---|---|---|---|
| FQ1 (Sep–Nov) | 1.077 | +7.7% | +7.7% above trend | 6 |
| FQ2 (Dec–Feb) | 1.0688 | +6.9% | +6.9% above trend | 6 |
| FQ3 (Mar–May) | 0.8888 | -11.1% | -11.1% below trend | 6 |
| FQ4 (Jun–Aug) | 1.0 | +0.0% | In line with trend | 0 |
How Spending Drives Revenue
Want this analysis for your portfolio?
I build custom revenue intelligence reports for investors and companies using SEC filing data, econometric modeling, and AI-powered insights.
Get in Touch