Astera Labs, Inc. ALAB
Revenue Intelligence Report • 12 quarters of SEC filing data • Updated 2026-03-15
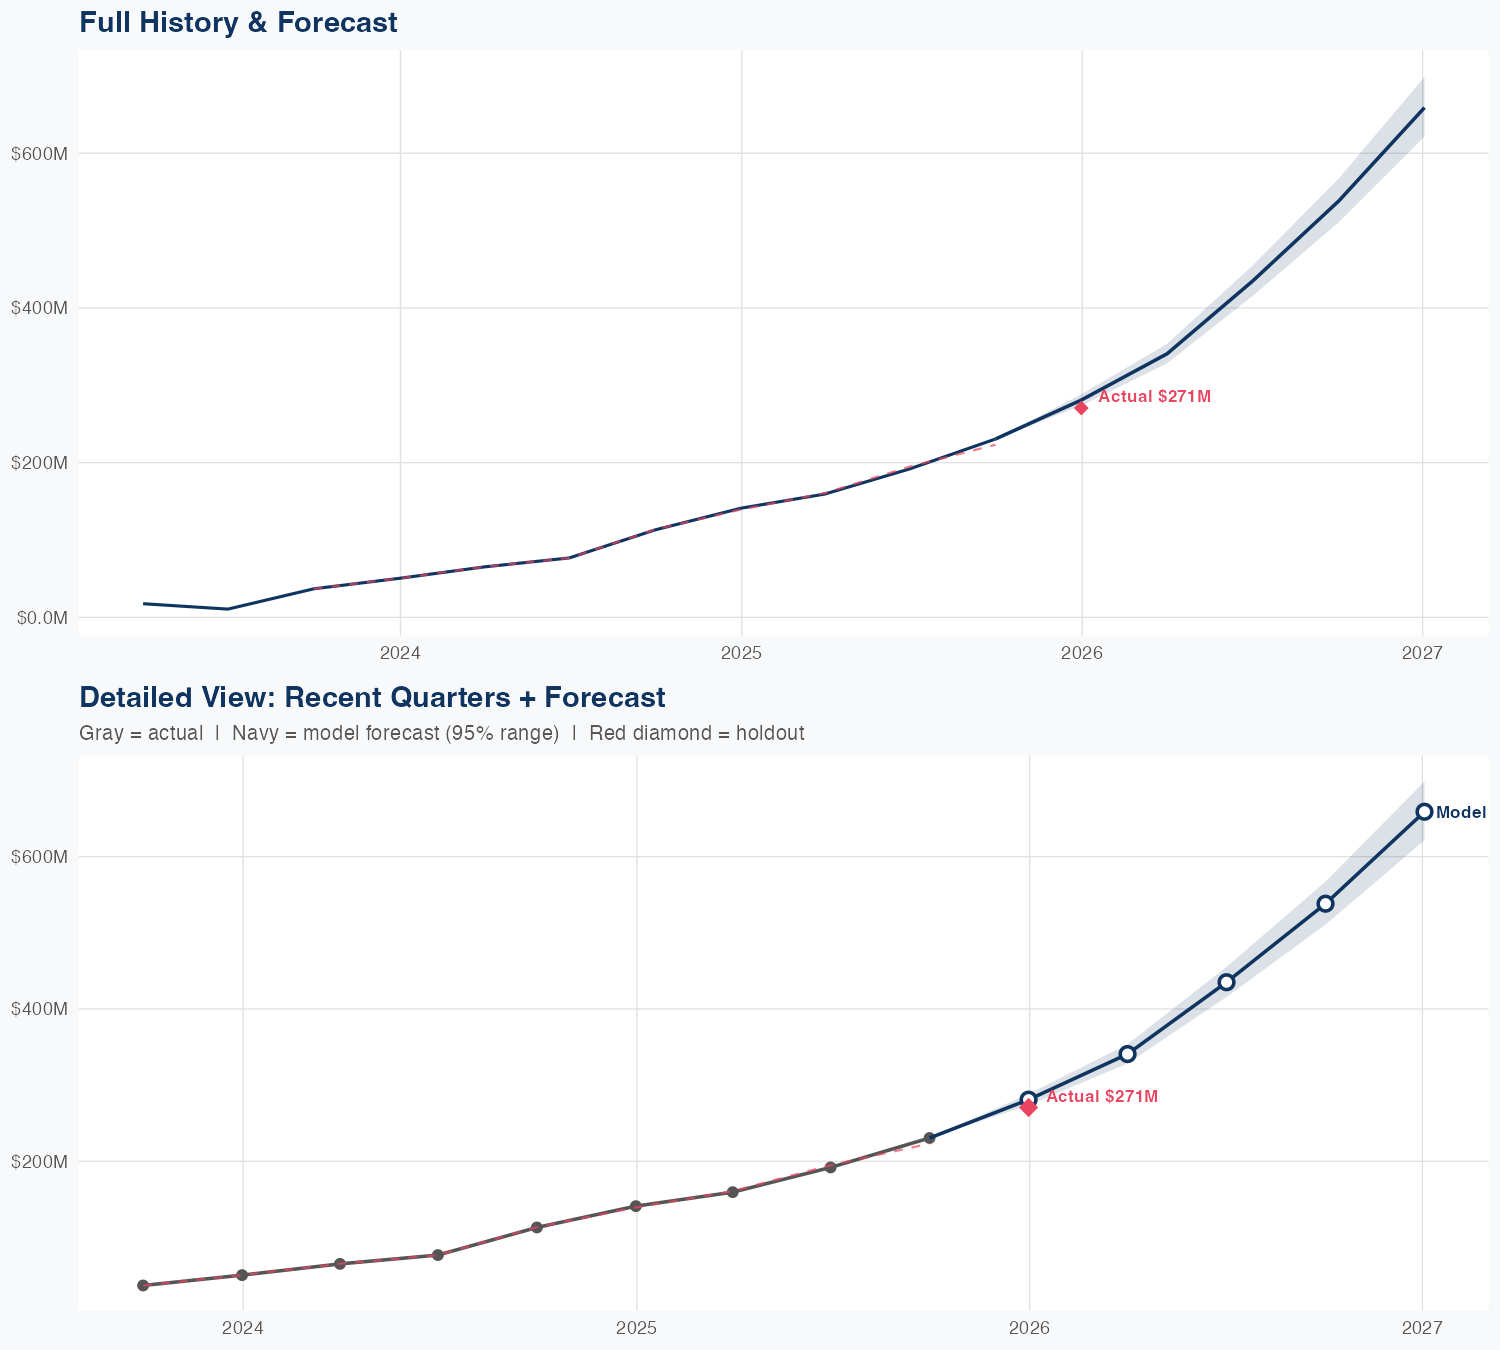
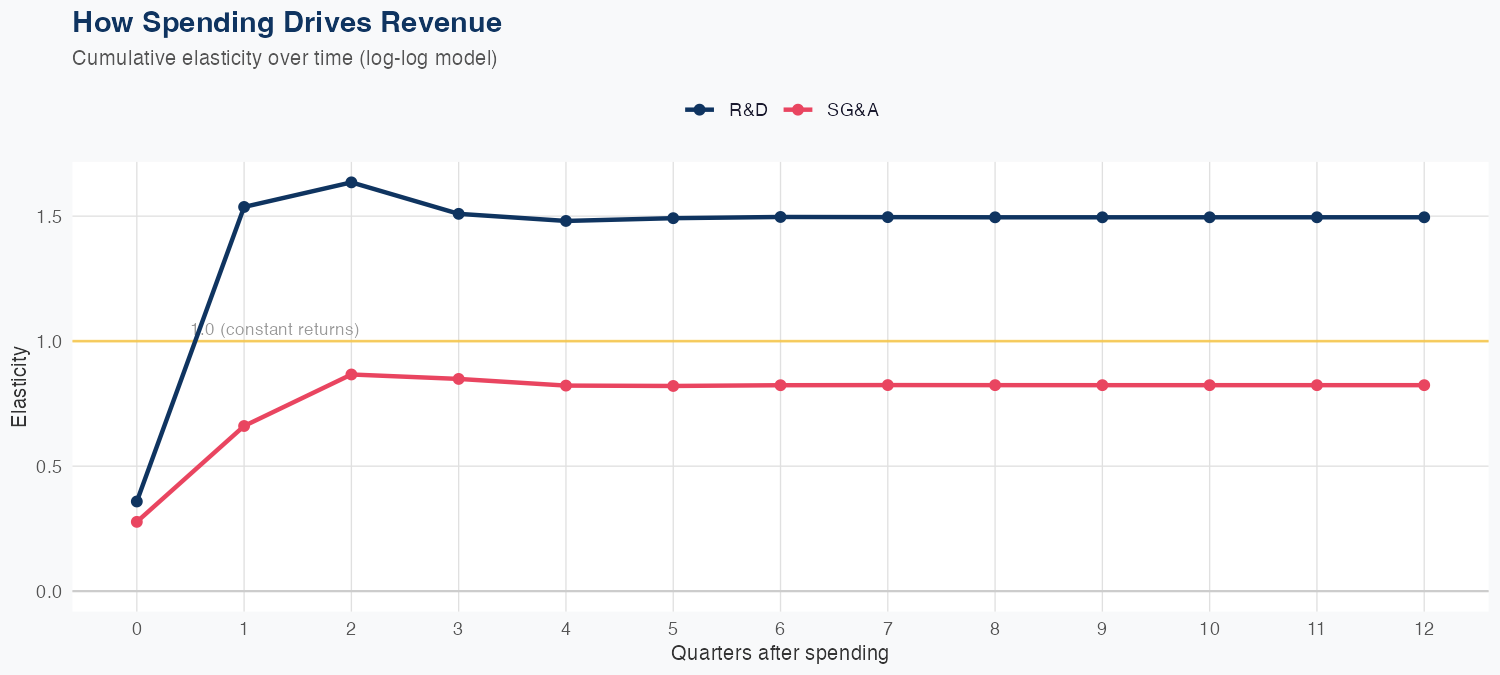
Revenue is primarily driven by R&D investment, with a 1% increase in R&D yielding a 1.50% rise in revenue, while SG&A contributes 0.82% per 1% increment. Under this log-log model, R&D is the stronger revenue lever, indicating outsized ROI from innovation spend relative to SG&A. The holdout test shows a reasonable forecast accuracy, with predicted 281M versus actual 271M (about 3.8% error). The FY revenue forecast of 1.973B represents a 131.4% YoY increase, signaling a robust growth outlook anchored in R&D-driven expansion, contingent on sustaining disciplined investment.
Investment Thesis
Our ARDL model tracks Astera Labs, Inc.'s revenue with exceptional precision (0.9% MAPE), indicating highly predictable cash flows. R&D investment shows a 1.50x multiplier — each 1% increase in R&D spend is associated with a 1.50% revenue increase, signaling strong innovation-to-revenue conversion. Sales & marketing spend shows a 0.82x elasticity, suggesting effective go-to-market execution.
Revenue Forecast
Quarterly Detail
| Quarter | Model Forecast | Actual | 95% Range | YoY Growth | Status |
|---|---|---|---|---|---|
| Q4 2025 | $281B | $271B | $274B – $288B | +99.1% | ✗ Outside range |
| Q2 2026 | $341B | $328B – $354B | +113.7% | ||
| Q3 2026 | $435B | $416B – $455B | +126.7% | ||
| Q4 2026 | $538B | $511B – $567B | +133.4% | ||
| Q1 2027 | $659B | $621B – $699B | +143.5% |
Seasonal Factors
| Fiscal Quarter | Seasonal Factor | vs Trend | Interpretation | Obs. |
|---|---|---|---|---|
| FQ1 (Sep–Nov) | 1.0016 | +0.2% | In line with trend | 3 |
| FQ2 (Dec–Feb) | 0.9982 | -0.2% | In line with trend | 3 |
| FQ3 (Mar–May) | 0.9982 | -0.2% | In line with trend | 2 |
| FQ4 (Jun–Aug) | 1.0004 | +0.0% | In line with trend | 2 |
How Spending Drives Revenue
Want this analysis for your portfolio?
I build custom revenue intelligence reports for investors and companies using SEC filing data, econometric modeling, and AI-powered insights.
Get in Touch