Allstate Corp ALL
Revenue Intelligence Report • 69 quarters of SEC filing data • Updated 2026-03-15
Allstate's revenue is on track to grow about 13% year over year, with FY revenue near $87 billion as the mix shifts toward SG&A-driven expansion alongside structural/platform growth. Our econometric model identifies the binding constraint as distribution capacity—the ability to scale the company's agent and digital marketing network to absorb higher SG&A spend and convert it into premiums. Structural/platform growth accounts for about 40% of the growth, while SG&A investments fund the remaining 60%, and the spending multiplier has been rising, suggesting incremental SG&A dollars are more productive than in the past. The key risk is a constraint to expanding the distribution channel or a deterioration in underwriting economics, including regulatory shifts, pricing pressure, or higher-than-expected claims costs.
Investment Thesis
Our ARDL model tracks Allstate Corp's revenue with exceptional precision (2.6% MAPE), indicating highly predictable cash flows. Each $1 of SG&A spending generates $5.66 in revenue, reflecting strong commercial efficiency.
Revenue Forecast
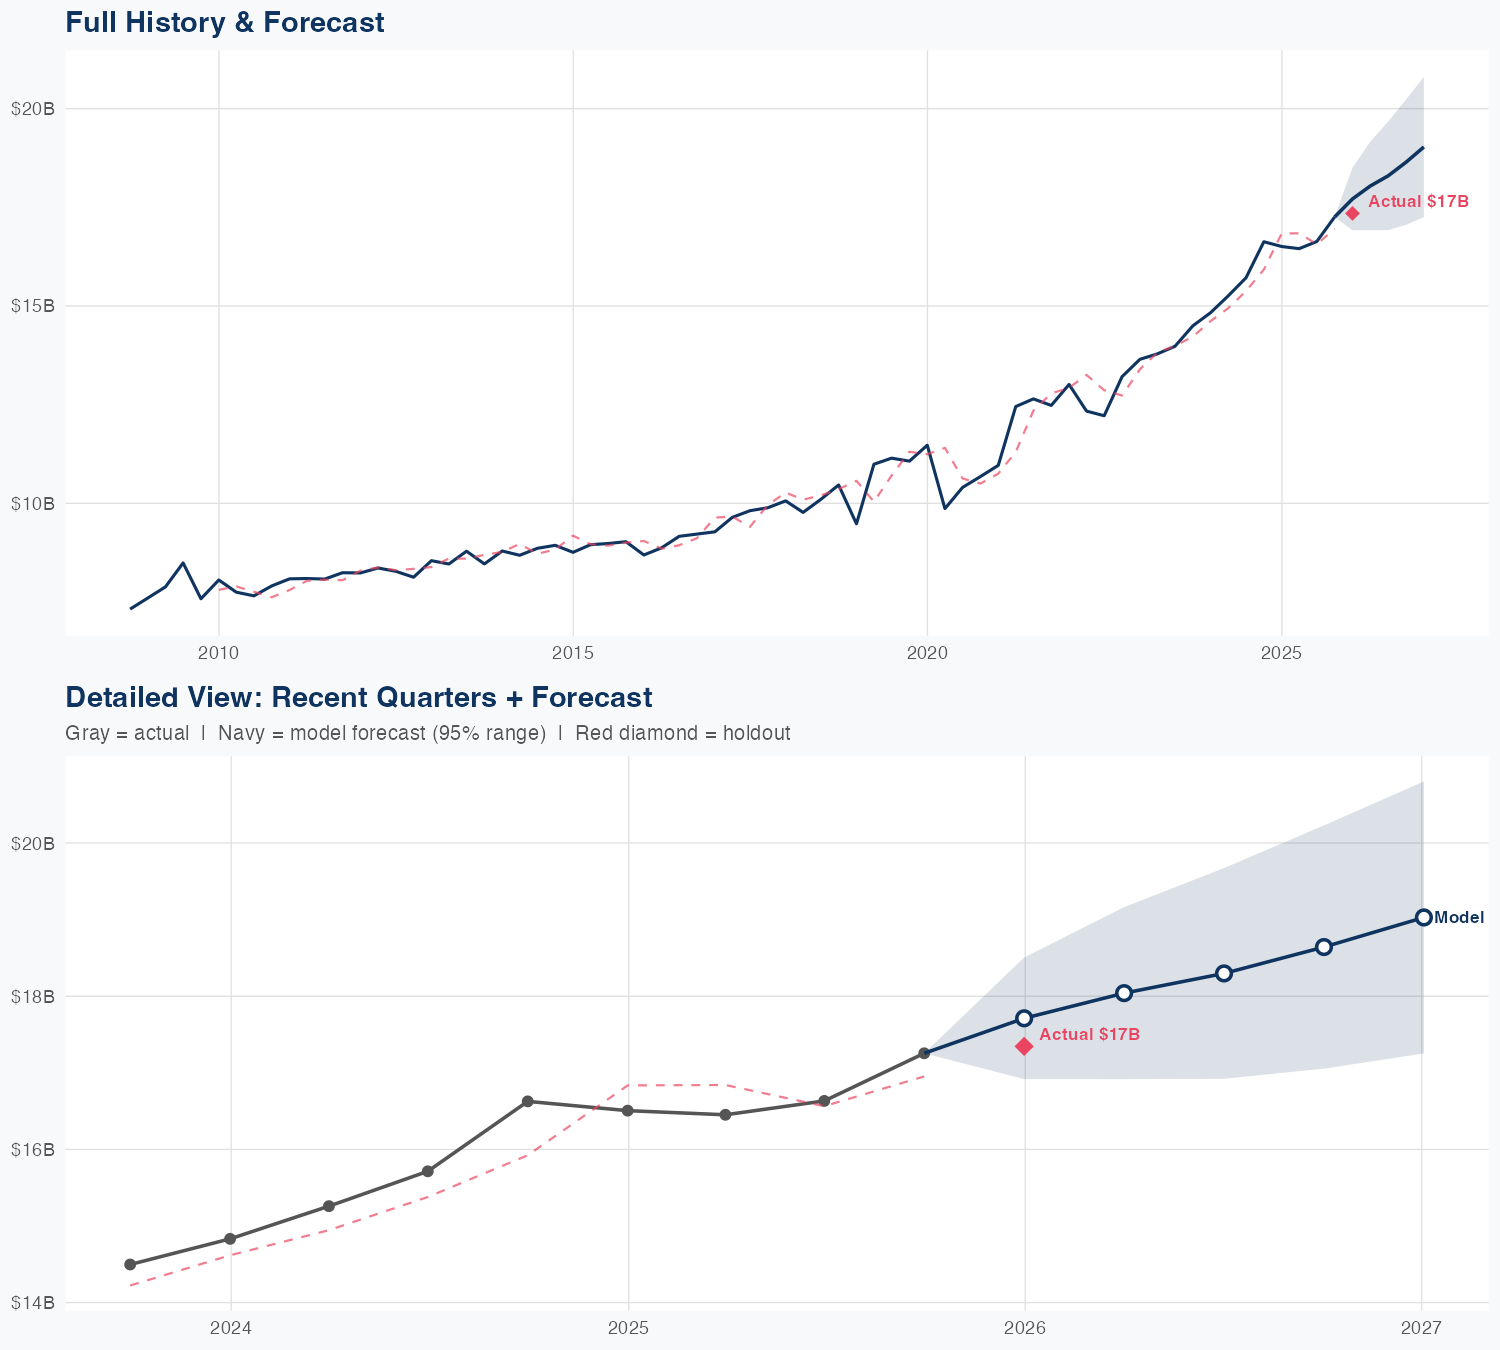
Quarterly Detail
| Quarter | Model Forecast | Actual | 95% Range | YoY Growth | Status |
|---|---|---|---|---|---|
| Q4 2025 | $18B | $17B | $16B – $19B | +7.6% | ✓ In range |
| Q2 2026 | $19B | $17B – $20B | +13.2% | ||
| Q3 2026 | $19B | $17B – $20B | +12.4% | ||
| Q4 2026 | $19B | $18B – $21B | +12.5% | ||
| Q1 2027 | $20B | $18B – $22B | +15.1% |
Seasonal Factors
| Fiscal Quarter | Seasonal Factor | vs Trend | Interpretation | Obs. |
|---|---|---|---|---|
| FQ1 (Sep–Nov) | 1.012 | +1.2% | In line with trend | 16 |
| FQ2 (Dec–Feb) | 1.0027 | +0.3% | In line with trend | 17 |
| FQ3 (Mar–May) | 0.9981 | -0.2% | In line with trend | 16 |
| FQ4 (Jun–Aug) | 1.006 | +0.6% | In line with trend | 16 |
How Spending Drives Revenue
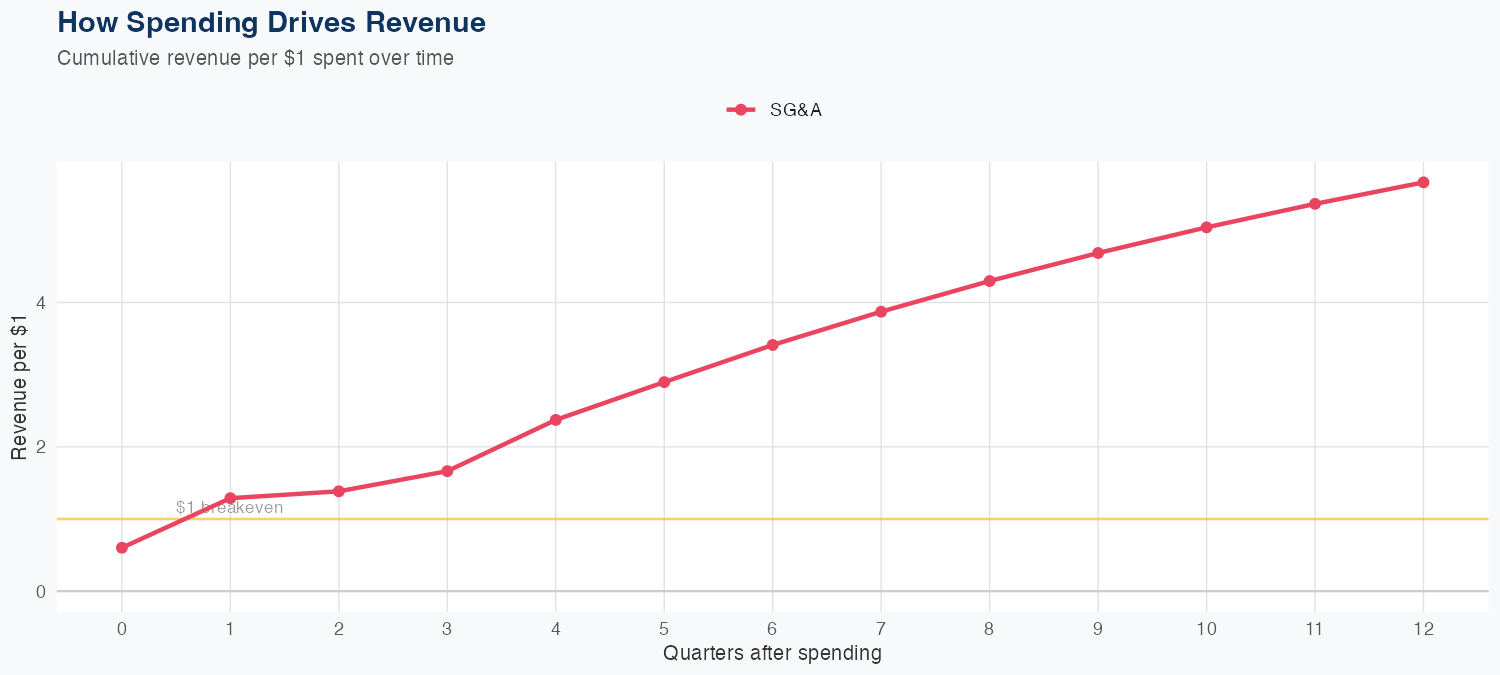
Spending Efficiency Over Time
Current SG&A multiplier: 0.2852
Want this analysis for your portfolio?
I build custom revenue intelligence reports for investors and companies using SEC filing data, econometric modeling, and AI-powered insights.
Get in Touch