Alnylam Pharmaceuticals, Inc. ALNY
Revenue Intelligence Report • 13 quarters of SEC filing data • Updated 2026-03-15
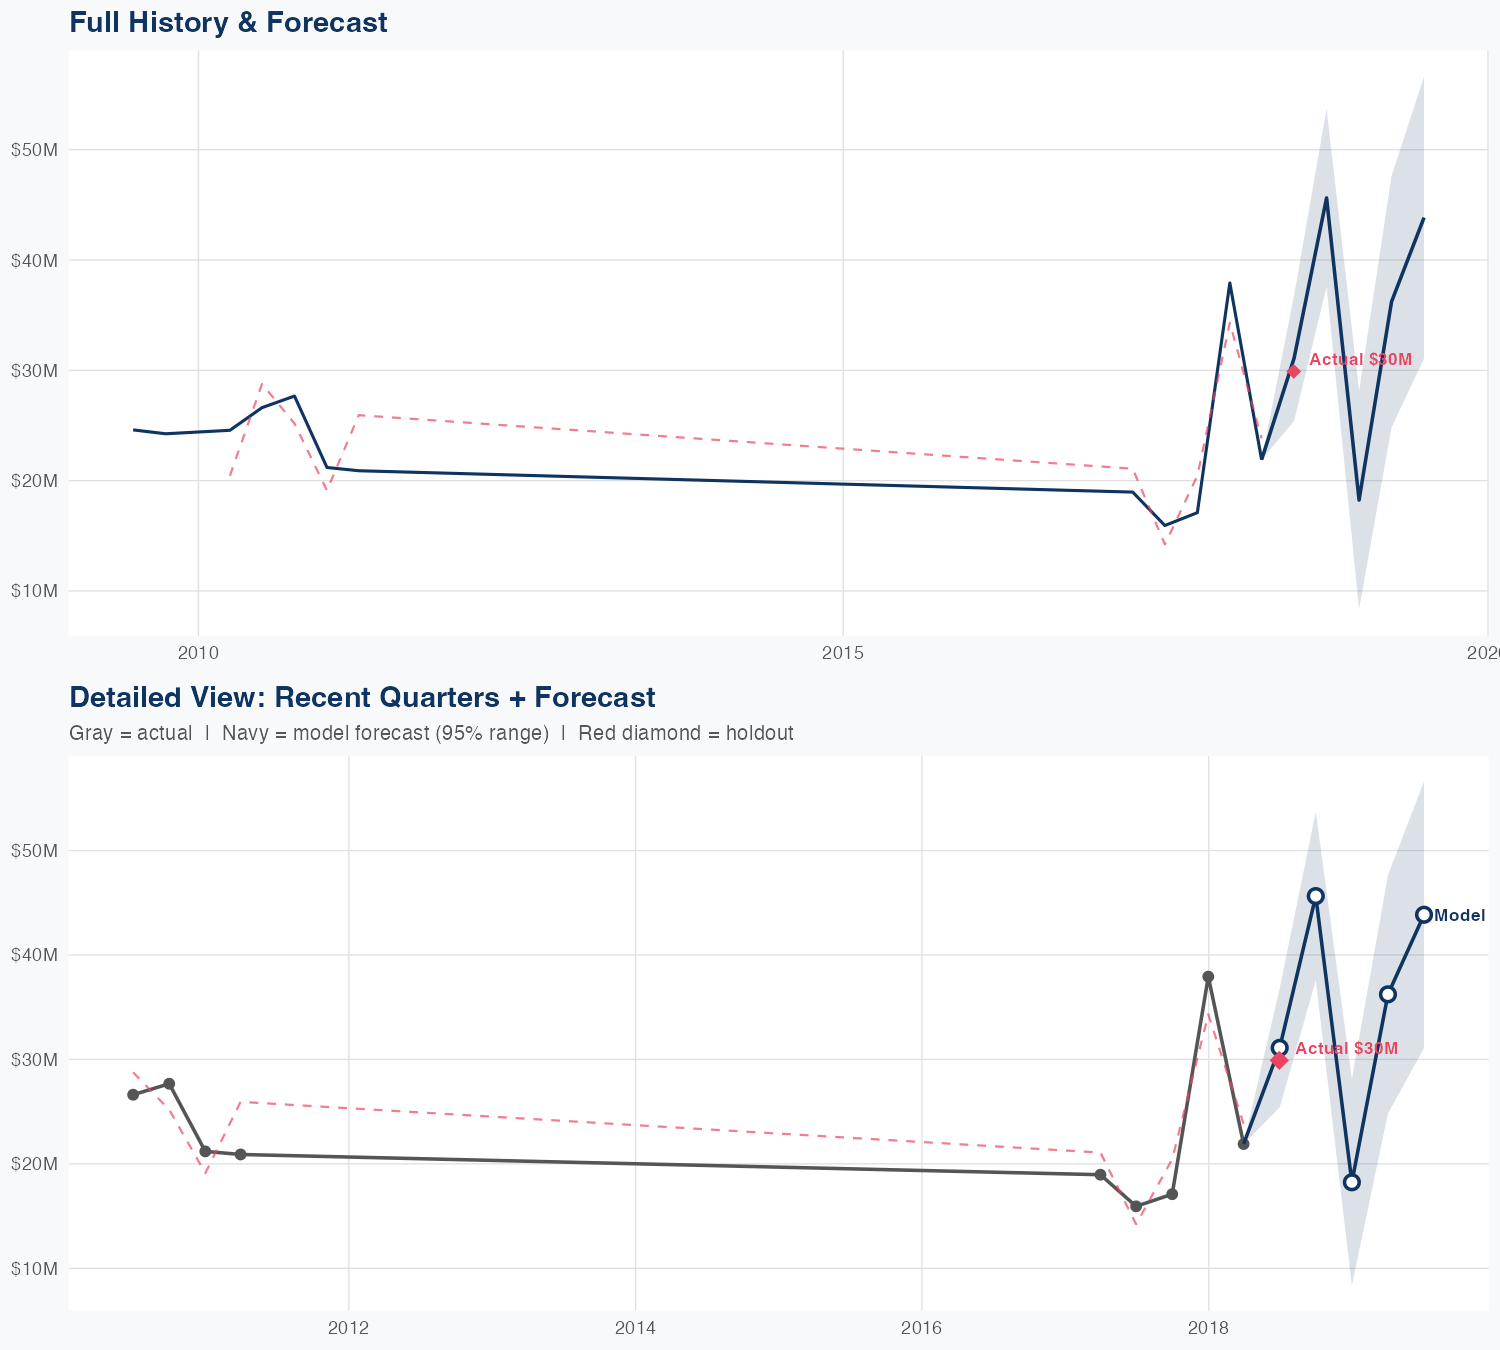
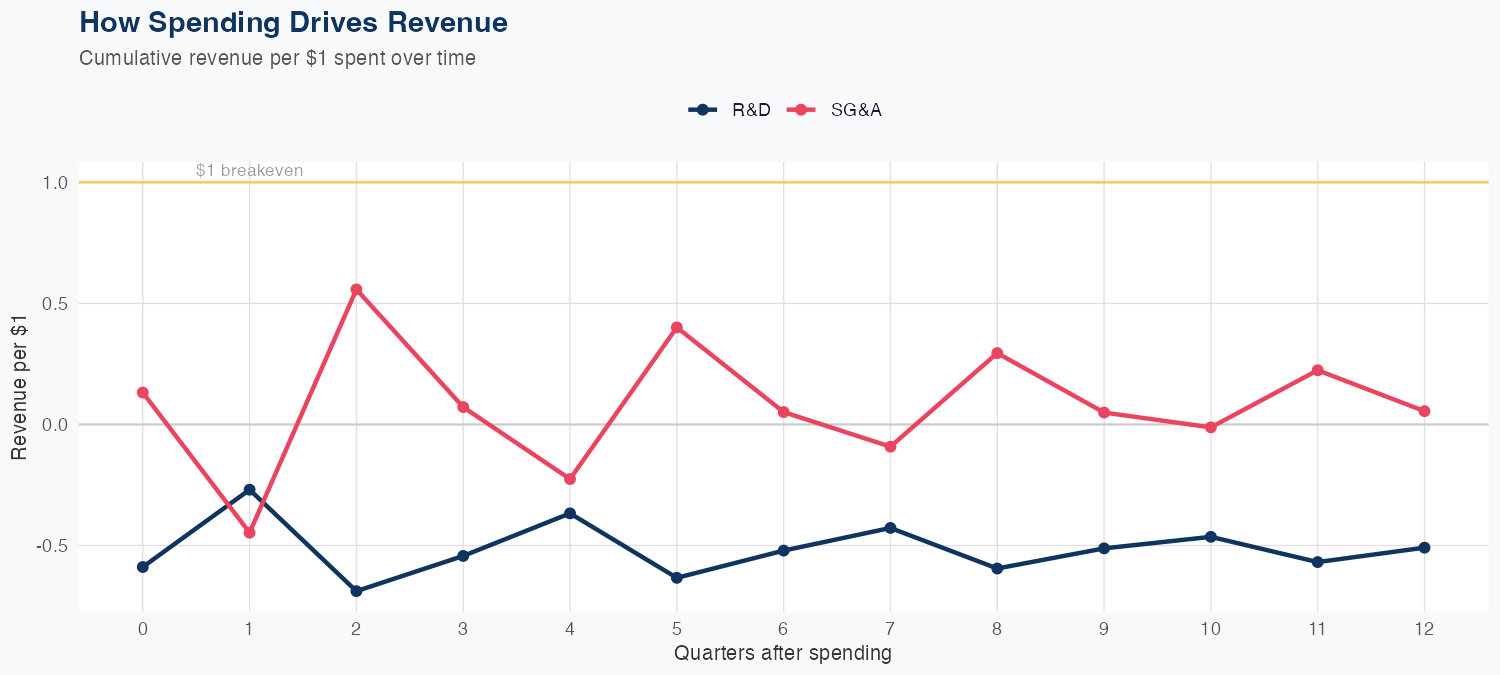
Revenue is driven primarily by SG&A spending, which yields a positive long-run impact of $0.05 of revenue per $1 spent, while R&D spending has a negative long-run impact of $-0.51 per $1. The modeling is linear, with an 11.8% MAPE and a holdout test predicting $31M for the latest quarter versus actual $30M (−4.0% error). The FY forecast calls for $144M in revenue, up 34.8% year over year, signaling meaningful top-line momentum. Outlook suggests growth hinges on SG&A leverage with R&D remaining a drag on long-run revenue, so investors should monitor spend mix and efficiency to gauge sustainability.
Investment Thesis
At 11.8% MAPE, the model captures Alnylam Pharmaceuticals, Inc.'s broad revenue trajectory, though quarterly variability suggests sensitivity to external factors. Each $1 of SG&A spending generates $0.06 in revenue, reflecting strong commercial efficiency.
Revenue Forecast
Quarterly Detail
| Quarter | Model Forecast | Actual | 95% Range | YoY Growth | Status |
|---|---|---|---|---|---|
| Q3 2018 | $31M | $30M | $25M – $37M | +95.2% | ✓ In range |
| Q4 2018 | $46M | $38M – $54M | +166.9% | ||
| Q1 2019 | $18M | $8.4M – $28M | -51.9% | ||
| Q2 2019 | $36M | $25M – $48M | +65.4% | ||
| Q3 2019 | $44M | $31M – $57M | +46.6% |
Seasonal Factors
| Fiscal Quarter | Seasonal Factor | vs Trend | Interpretation | Obs. |
|---|---|---|---|---|
| FQ1 (Sep–Nov) | 1.0985 | +9.9% | +9.9% above trend | 2 |
| FQ2 (Dec–Feb) | 1.1092 | +10.9% | +10.9% above trend | 2 |
| FQ3 (Mar–May) | 0.9189 | -8.1% | -8.1% below trend | 4 |
| FQ4 (Jun–Aug) | 1.0195 | +1.9% | In line with trend | 3 |
How Spending Drives Revenue
Want this analysis for your portfolio?
I build custom revenue intelligence reports for investors and companies using SEC filing data, econometric modeling, and AI-powered insights.
Get in Touch