Anthropic
Anthropic earned $14.52B in gross profit selling access to Claude in Q3. Developing models and running the business absorbed that profit, leaving a $567M operating loss. Revaluing financing instruments drove most of the $23.29B net loss. The November IPO introduces a new stock-compensation charge and changes how many shares divide those earnings. Final IPO prospectus.
From Claude revenue to gross profit
Anthropic reports expenses two ways. Its $9.86B of total compute and infrastructure spending includes research, development, and customer workloads. Note 8 assigns $2.43B to Q3 cost of revenue, primarily the cost of serving paying customers. Subtracting that from $16.96B of sales gives gross profit. R&D then consumed $9.50B, sales and marketing $2.81B, and general and administrative expenses $2.78B. These figures come from subtracting the first-half totals from the nine-month totals. First-half filing · Nine-month filing, Note 8.
Two costs explain much of the swing from a $974M operating profit in Q2 to a $567M operating loss in Q3. Anthropic received $5.0B of higher-priced short-term compute during Q3 and recognized $1.96B in noncash donation-matching charges. Below operating income, the company recorded a $21.94B fair-value loss on financing instruments and another $1.56B valuation loss within other expense. A rise in the value of shares deliverable to a noteholder can create a loss for the issuer before any cash changes hands. Quarterly results and reconciliations.
What the IPO changes for Q4
The Q4 model projects $20.97B in revenue and $17.99B in gross profit. Its 80% revenue interval is $16.10B to $27.50B. Anthropic reported $81B of annualized run-rate revenue at October 31. Dividing by four gives $20.25B if that pace lasts a full quarter. The metric annualizes 28 days of usage and one month of subscriptions. We use it as a cross-check outside the model. Operating metrics and definitions.
Anthropic estimated a $14.7B cumulative expense as the IPO triggered vesting conditions on restricted stock units. On our estimated 6.91B weighted-average Q4 shares, that charge alone costs $2.13 per share with taxes held fixed. With no new fair-value gain or loss, the median Q4 basic EPS is −$2.21 and the 80% interval is −$3.66 to −$1.43. Reported diluted EPS also depends on the actual revaluations, vesting, and shares outstanding. Capitalization and stock-based compensation · November 20 closing terms.
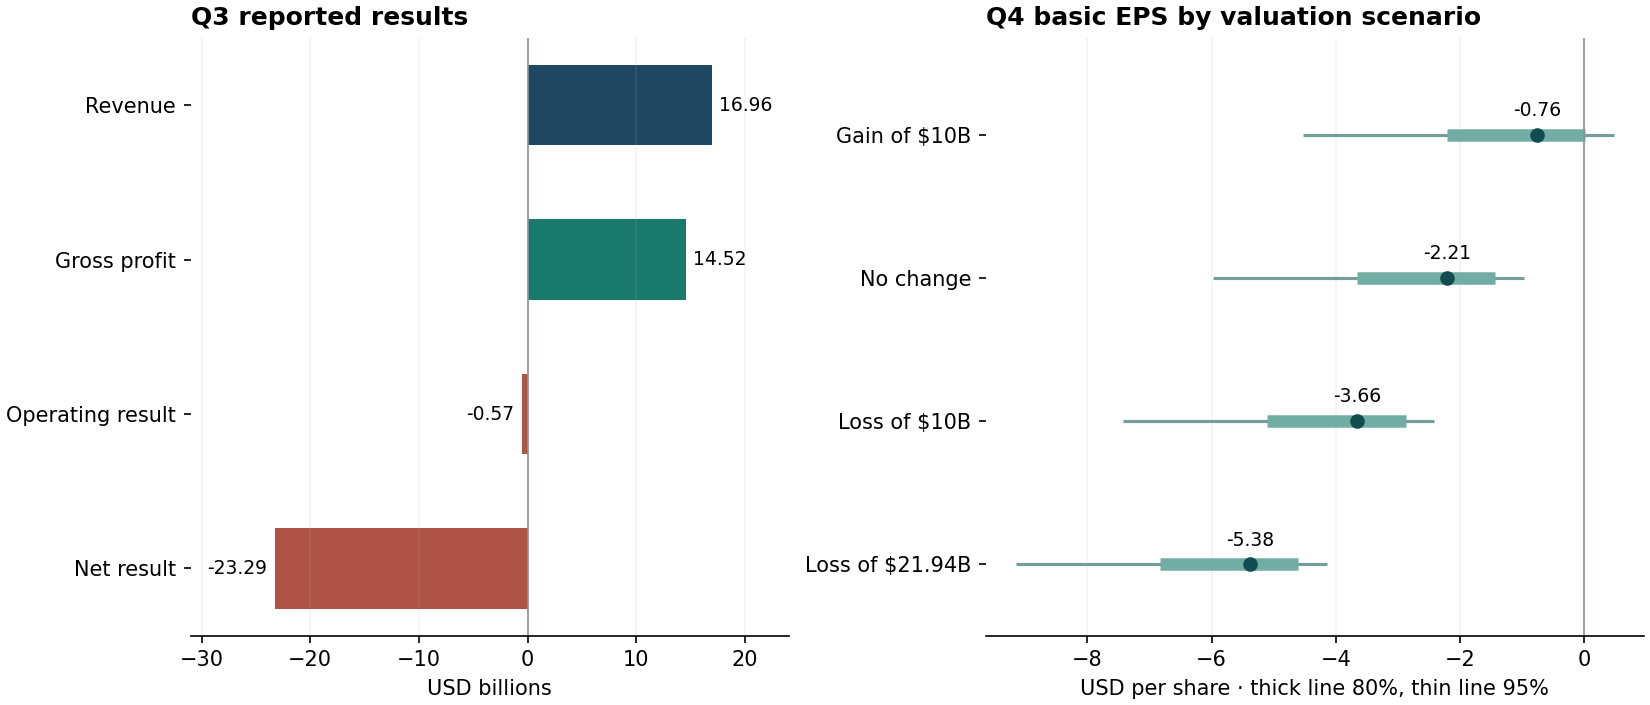
How much can valuation changes move EPS?
Some Amazon notes converted at the IPO. Amazon’s ownership cap left rollover notes outstanding. A new $10B valuation loss would deepen Q4 loss per share by about $1.45 on the same operating results. Each row applies a fixed combined valuation change to the same 6,000 operating paths. The scenarios carry no assigned probabilities. Outstanding notes and ownership cap.
| Q4 combined valuation change | Median basic EPS | 80% conditional interval |
|---|---|---|
| Gain of $10B | −$0.76 | −$2.21 to $0.02 |
| No change | −$2.21 | −$3.66 to −$1.43 |
| Loss of $10B | −$3.66 | −$5.10 to −$2.88 |
| Loss of $21.94B | −$5.38 | −$6.83 to −$4.60 |
Four-quarter income statement
Each forecast column shows the median of 6,000 simulated outcomes. The base case holds valuation changes at zero. The stock-compensation rows show amounts already included in the four expense functions. Each simulated statement reconciles from sales to EPS. Separate line-item medians can differ from their sum.
| Measure | Q3 2026 actual¹ | Q4 2026 | Q1 2027 | Q2 2027 | Q3 2027 |
|---|---|---|---|---|---|
| Revenue | $16.96B | $20.97B | $30.93B | $47.90B | $58.20B |
| Cost of revenue | $2.43B | $2.97B | $3.61B | $5.21B | $6.09B |
| Gross profit | $14.52B | $17.99B | $26.83B | $41.73B | $50.68B |
| Gross margin | 85.7% | 85.9% | 88.3% | 89.0% | 89.2% |
| Research and development | $9.50B | $23.13B | $17.62B | $25.26B | $29.21B |
| Sales and marketing | $2.81B | $5.46B | $5.15B | $7.71B | $9.18B |
| General and administrative | $2.78B | $5.43B | $6.23B | $9.80B | $12.47B |
| Operating income (loss) | −$0.57B | −$16.43B | −$3.25B | −$3.06B | −$2.91B |
| IPO stock compensation included above | $0.00B | $14.70B | $0.00B | $0.00B | $0.00B |
| Extra recurring RSU expense included above | $0.00B | $1.37B | $3.00B | $3.00B | $3.00B |
| Interest income | $1.25B | $1.63B | $2.09B | $2.09B | $2.09B |
| Other income (expense), excluding valuation changes | −$0.08B | −$0.08B | −$0.08B | −$0.08B | −$0.08B |
| Combined fair-value gains (losses) | −$23.49B | $0.00B | $0.00B | $0.00B | $0.00B |
| Income (loss) before tax | −$22.89B | −$14.88B | −$1.24B | −$1.05B | −$0.90B |
| Tax provision | $0.40B | $0.40B | $0.40B | $0.40B | $0.40B |
| Net income (loss) | −$23.29B | −$15.28B | −$1.64B | −$1.45B | −$1.30B |
| Weighted-average basic shares | 2.18B | 6.91B | 12.52B | 12.52B | 12.52B |
| Basic EPS | −$10.69 | −$2.21 | −$0.13 | −$0.12 | −$0.10 |
| Shares with illustrative award dilution | 2.18B | 6.91B | 12.52B | 12.52B | 12.52B |
| EPS with illustrative award dilution | −$10.69 | −$2.21 | −$0.13 | −$0.12 | −$0.10 |
80% and 95% intervals for each income-statement line
Q4 2026
| Measure | Median | 80% interval | 95% interval |
|---|---|---|---|
| Revenue | $20.97B | $16.10B to $27.50B | $13.14B to $34.00B |
| Cost of revenue | $2.97B | $1.92B to $4.75B | $1.46B to $6.78B |
| Gross profit | $17.99B | $13.35B to $23.68B | $10.67B to $29.57B |
| Gross margin | 85.9% | 79.6% to 90.0% | 71.7% to 92.4% |
| Research and development | $23.13B | $19.11B to $29.41B | $17.26B to $36.57B |
| Sales and marketing | $5.46B | $4.34B to $7.17B | $3.78B to $8.90B |
| General and administrative | $5.43B | $3.02B to $12.00B | $2.26B to $24.15B |
| Operating income (loss) | −$16.43B | −$26.43B to −$11.03B | −$42.46B to −$7.85B |
| IPO stock compensation included above | $14.70B | $14.70B to $14.70B | $14.70B to $14.70B |
| Extra recurring RSU expense included above | $1.37B | $1.37B to $1.37B | $1.37B to $1.37B |
| Interest income | $1.63B | $1.63B to $1.63B | $1.63B to $1.63B |
| Other income (expense), excluding valuation changes | −$0.08B | −$0.08B to −$0.08B | −$0.08B to −$0.08B |
| Combined fair-value gains (losses) | $0.00B | $0.00B to $0.00B | $0.00B to $0.00B |
| Income (loss) before tax | −$14.88B | −$24.88B to −$9.48B | −$40.91B to −$6.29B |
| Tax provision | $0.40B | $0.40B to $0.40B | $0.40B to $0.40B |
| Net income (loss) | −$15.28B | −$25.27B to −$9.88B | −$41.31B to −$6.69B |
| Weighted-average basic shares | 6.91B | 6.91B to 6.91B | 6.91B to 6.91B |
| Basic EPS | −$2.21 | −$3.66 to −$1.43 | −$5.98 to −$0.97 |
| Shares with illustrative award dilution | 6.91B | 6.91B to 6.91B | 6.91B to 6.91B |
| EPS with illustrative award dilution | −$2.21 | −$3.66 to −$1.43 | −$5.98 to −$0.97 |
Q1 2027
| Measure | Median | 80% interval | 95% interval |
|---|---|---|---|
| Revenue | $30.93B | $17.11B to $52.26B | $11.48B to $77.10B |
| Cost of revenue | $3.61B | $1.60B to $7.68B | $0.98B to $12.81B |
| Gross profit | $26.83B | $14.63B to $45.79B | $9.50B to $67.08B |
| Gross margin | 88.3% | 80.3% to 93.0% | 71.4% to 95.1% |
| Research and development | $17.62B | $9.57B to $33.50B | $6.75B to $53.62B |
| Sales and marketing | $5.15B | $2.72B to $9.63B | $1.86B to $14.51B |
| General and administrative | $6.23B | $1.74B to $23.77B | $0.87B to $63.34B |
| Operating income (loss) | −$3.25B | −$25.38B to $6.98B | −$73.71B to $14.45B |
| IPO stock compensation included above | $0.00B | $0.00B to $0.00B | $0.00B to $0.00B |
| Extra recurring RSU expense included above | $3.00B | $3.00B to $3.00B | $3.00B to $3.00B |
| Interest income | $2.09B | $2.09B to $2.09B | $2.09B to $2.09B |
| Other income (expense), excluding valuation changes | −$0.08B | −$0.08B to −$0.08B | −$0.08B to −$0.08B |
| Combined fair-value gains (losses) | $0.00B | $0.00B to $0.00B | $0.00B to $0.00B |
| Income (loss) before tax | −$1.24B | −$23.37B to $8.99B | −$71.70B to $16.46B |
| Tax provision | $0.40B | $0.40B to $0.40B | $0.40B to $0.40B |
| Net income (loss) | −$1.64B | −$23.76B to $8.59B | −$72.09B to $16.06B |
| Weighted-average basic shares | 12.52B | 12.52B to 12.52B | 12.52B to 12.52B |
| Basic EPS | −$0.13 | −$1.90 to $0.69 | −$5.76 to $1.28 |
| Shares with illustrative award dilution | 12.52B | 12.52B to 15.31B | 12.52B to 15.31B |
| EPS with illustrative award dilution | −$0.13 | −$1.90 to $0.56 | −$5.76 to $1.05 |
Q2 2027
| Measure | Median | 80% interval | 95% interval |
|---|---|---|---|
| Revenue | $47.90B | $19.33B to $111.09B | $10.89B to $199.15B |
| Cost of revenue | $5.21B | $1.77B to $14.92B | $0.90B to $29.58B |
| Gross profit | $41.73B | $16.77B to $97.36B | $9.12B to $176.70B |
| Gross margin | 89.0% | 80.6% to 93.7% | 70.5% to 95.8% |
| Research and development | $25.26B | $10.63B to $64.12B | $6.34B to $123.59B |
| Sales and marketing | $7.71B | $3.04B to $19.19B | $1.79B to $34.49B |
| General and administrative | $9.80B | $2.04B to $52.39B | $0.89B to $146.92B |
| Operating income (loss) | −$3.06B | −$50.61B to $15.79B | −$154.58B to $35.15B |
| IPO stock compensation included above | $0.00B | $0.00B to $0.00B | $0.00B to $0.00B |
| Extra recurring RSU expense included above | $3.00B | $3.00B to $3.00B | $3.00B to $3.00B |
| Interest income | $2.09B | $2.09B to $2.09B | $2.09B to $2.09B |
| Other income (expense), excluding valuation changes | −$0.08B | −$0.08B to −$0.08B | −$0.08B to −$0.08B |
| Combined fair-value gains (losses) | $0.00B | $0.00B to $0.00B | $0.00B to $0.00B |
| Income (loss) before tax | −$1.05B | −$48.60B to $17.80B | −$152.57B to $37.16B |
| Tax provision | $0.40B | $0.40B to $0.40B | $0.40B to $0.40B |
| Net income (loss) | −$1.45B | −$48.99B to $17.41B | −$152.97B to $36.76B |
| Weighted-average basic shares | 12.52B | 12.52B to 12.52B | 12.52B to 12.52B |
| Basic EPS | −$0.12 | −$3.91 to $1.39 | −$12.22 to $2.94 |
| Shares with illustrative award dilution | 12.52B | 12.52B to 15.31B | 12.52B to 15.31B |
| EPS with illustrative award dilution | −$0.12 | −$3.91 to $1.14 | −$12.22 to $2.40 |
Q3 2027
| Measure | Median | 80% interval | 95% interval |
|---|---|---|---|
| Revenue | $58.20B | $18.10B to $182.24B | $8.63B to $403.03B |
| Cost of revenue | $6.09B | $1.62B to $22.71B | $0.72B to $54.15B |
| Gross profit | $50.68B | $15.22B to $161.50B | $7.27B to $354.69B |
| Gross margin | 89.2% | 81.1% to 94.1% | 70.4% to 96.0% |
| Research and development | $29.21B | $9.89B to $97.98B | $5.55B to $220.44B |
| Sales and marketing | $9.18B | $2.81B to $30.61B | $1.56B to $68.14B |
| General and administrative | $12.47B | $2.09B to $83.24B | $0.85B to $269.97B |
| Operating income (loss) | −$2.91B | −$70.87B to $25.16B | −$249.13B to $67.24B |
| IPO stock compensation included above | $0.00B | $0.00B to $0.00B | $0.00B to $0.00B |
| Extra recurring RSU expense included above | $3.00B | $3.00B to $3.00B | $3.00B to $3.00B |
| Interest income | $2.09B | $2.09B to $2.09B | $2.09B to $2.09B |
| Other income (expense), excluding valuation changes | −$0.08B | −$0.08B to −$0.08B | −$0.08B to −$0.08B |
| Combined fair-value gains (losses) | $0.00B | $0.00B to $0.00B | $0.00B to $0.00B |
| Income (loss) before tax | −$0.90B | −$68.86B to $27.17B | −$247.12B to $69.25B |
| Tax provision | $0.40B | $0.40B to $0.40B | $0.40B to $0.40B |
| Net income (loss) | −$1.30B | −$69.26B to $26.77B | −$247.52B to $68.85B |
| Weighted-average basic shares | 12.52B | 12.52B to 12.52B | 12.52B to 12.52B |
| Basic EPS | −$0.10 | −$5.53 to $2.14 | −$19.77 to $5.50 |
| Shares with illustrative award dilution | 12.52B | 12.52B to 15.31B | 12.52B to 15.31B |
| EPS with illustrative award dilution | −$0.10 | −$5.53 to $1.75 | −$19.77 to $4.50 |
What could improve earnings?
Replace expensive short-term compute and keep the new capacity busy. A 10% saving on a quarter with Q3’s $5.0B short-term compute bill would add $500M to operating income at unchanged usage, close to the $567M Q3 operating loss. The trade-off is committing to capacity before demand arrives. Anthropic disclosed about $900.9B in purchase and lease commitments, including $70.7B due in the twelve months following September 30. Compute costs and commitments.
Grow paid usage faster than research and distribution expense. In Q3, one extra percentage point of operating margin was worth about $170M. The gross profit figure captures the cost of serving paid workloads. Research compute, channel partner fees, and compute for free access can still absorb those gains. The next filing will show how much additional revenue Anthropic kept after those costs. Expense definitions and quarterly results.
The IPO and private placement give Anthropic more time to make that model work. The company received about $91.6B of gross IPO proceeds and $26.0B in the private placement. It had generated $6.6B in operating cash flow in the first nine months, even as it recorded a $104.0B net loss. New financing increases available cash, while earnings depend on the returns Anthropic earns with it. IPO closing · Liquidity and cash flows.
How much history supports the forecast?
Anthropic disclosed eight consecutive quarterly sales figures, the minimum for the site’s seasonal MCMC model. That leaves no later reported quarter for testing the full revenue-to-EPS forecast. The middle and outer bands show how much the simulated paths vary given the model. All eight quarters come from a period of rapid growth, so the range widens sharply farther out.
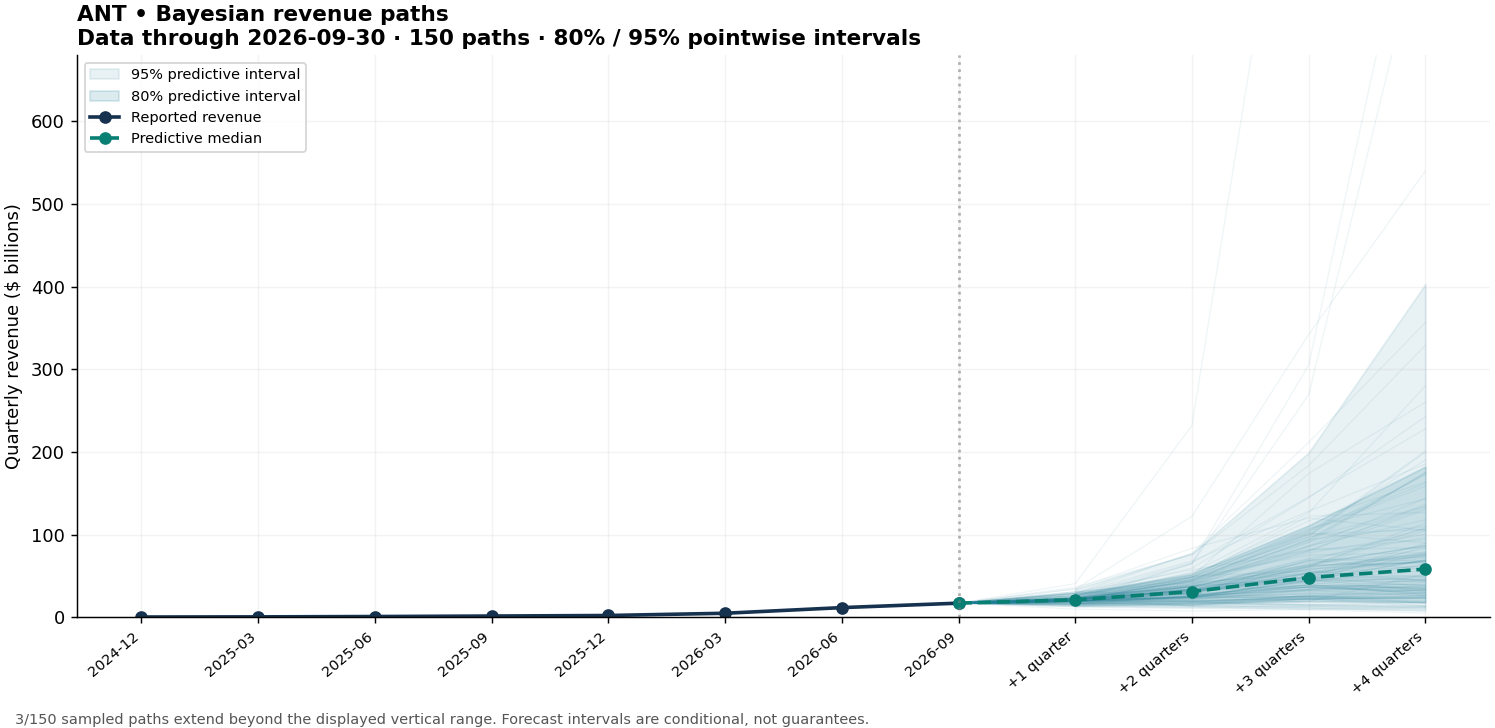
We could test the gross-profit step separately. Using expense data only through June and supplying actual Q3 sales, it estimated $14.83B of Q3 gross profit, against $14.52B realized. Simply carrying forward the first-half gross margin gave $14.48B, closer in this one comparison. Both methods knew Q3 sales for this test.
Model, share count, and IPO assumptions
Four NUTS chains fit a seasonal autoregression to quarterly log sales growth. Its long-run growth prior is centered on zero. Each revenue path feeds a separate four-chain Gibbs model for correlated changes in four expense-to-sales ratios. We use five non-overlapping functional periods, including the two reported half-years, and adjust changes for the time between period midpoints. Paths begin with Q3’s expense mix. A fixed persistence of 0.65 draws cost ratios back toward that starting point. The models use Student-t shocks. Maximum R̂ was 1.002, minimum bulk effective sample size was 2,331, and the revenue fit had zero divergences.
Recurring operating costs retain historical stock compensation and the variability of donation expense. We add the disclosed $14.7B IPO charge once, plus an illustrative $3.0B of incremental recurring RSU expense per full quarter, prorated after the Q4 closing. The recurring amount is a modeling assumption. The prospectus describes $24.1B of unrecognized RSU expense over about two years under a September 30 hypothetical. We allocate the incremental charges 2% to cost of revenue, 75% to R&D, 13% to sales and marketing, and 10% to G&A. Actual allocation changes gross profit, while leaving the total operating charge the same. RSU accounting and functional expenses.
Our share-count illustration starts with 2.199B economic shares at September 30. The fully exercised offering implies 13.367B legally outstanding shares. Excluding 846.84M public-benefit shares held by a consolidated subsidiary and two non-economic shares leaves 12.520B. We assume that base for 42 of 92 days in Q4 and for all later quarters, before additional vesting, exercises, or note conversions. For the award-dilution illustration, profitable paths add up to 1.712B incremental option shares at the $83 IPO price and 1.074B RSUs, prorated after closing. Loss-making paths retain the basic share count because adding shares would reduce the loss per share. The illustration holds Amazon’s rollover notes outstanding. Actual diluted EPS will depend on the average market price, vesting, conversion terms, and any related earnings adjustments. Offering share reconciliation · Full exercise of underwriters’ option.
We carry forward Q3 interest income of $1.248B, add a 3% annual yield on about $112.7B of new funds after estimated fees and RSU withholding, and prorate that increment in Q4. We hold other expense excluding valuation changes at $83M and the quarterly tax provision at $396M. Interest, taxes, future dilution and instrument valuations can move outside the plotted ranges. Use of proceeds and quarterly statements.
Historical quarterly inputs
| Quarter ended | Revenue | Gross profit | Operating income | Net income |
|---|---|---|---|---|
| 2024-12-31 | $0.20B | — | — | — |
| 2025-03-31 | $0.38B | — | −$0.94B | −$6.59B |
| 2025-06-30 | $0.79B | — | −$1.20B | −$6.38B |
| 2025-09-30 | $1.38B | $0.60B | −$3.09B | −$12.14B |
| 2025-12-31 | $2.04B | $1.06B | −$2.84B | −$16.86B |
| 2026-03-31 | $4.73B | — | −$1.67B | −$14.44B |
| 2026-06-30 | $11.55B | — | $0.97B | −$66.31B |
| 2026-09-30 | $16.96B | $14.52B | −$0.57B | −$23.29B |
Dashes mark quarters for which the cited periods did not supply a standalone value. The model keeps the first-half functional costs as six-month totals. Original registration statement · Final prospectus.