Aon Plc AON
Revenue Intelligence Report • 70 quarters of SEC filing data • Updated 2026-03-15
Aon’s revenue is forecast to grow about 8.7% year over year to roughly $20.3 billion, supported by durable demand across risk, retirement and advisory services and ongoing pricing power. In our econometric model, structural/platform growth accounts for about 58% of the revenue uplift, with SG&A investments contributing around 42% and R&D essentially flat. The time-varying analysis shows the SG&A multiplier has declined from 0.42 to 0.12, signaling rising operating leverage and that growth is increasingly driven by platform scale and recurring revenue rather than incremental spending. The binding constraint on revenue growth is delivery capacity—the ability to staff and service more client engagements. Key risk: if talent recruitment, deployment or utilization cannot keep pace with demand, the upside to the forecast could be limited.
Investment Thesis
The econometric model achieves strong accuracy (5.5% MAPE), suggesting Aon Plc's revenue trajectory is well-characterized by its spending patterns. Each $1 of SG&A spending generates $2.14 in revenue, reflecting strong commercial efficiency.
Revenue Forecast
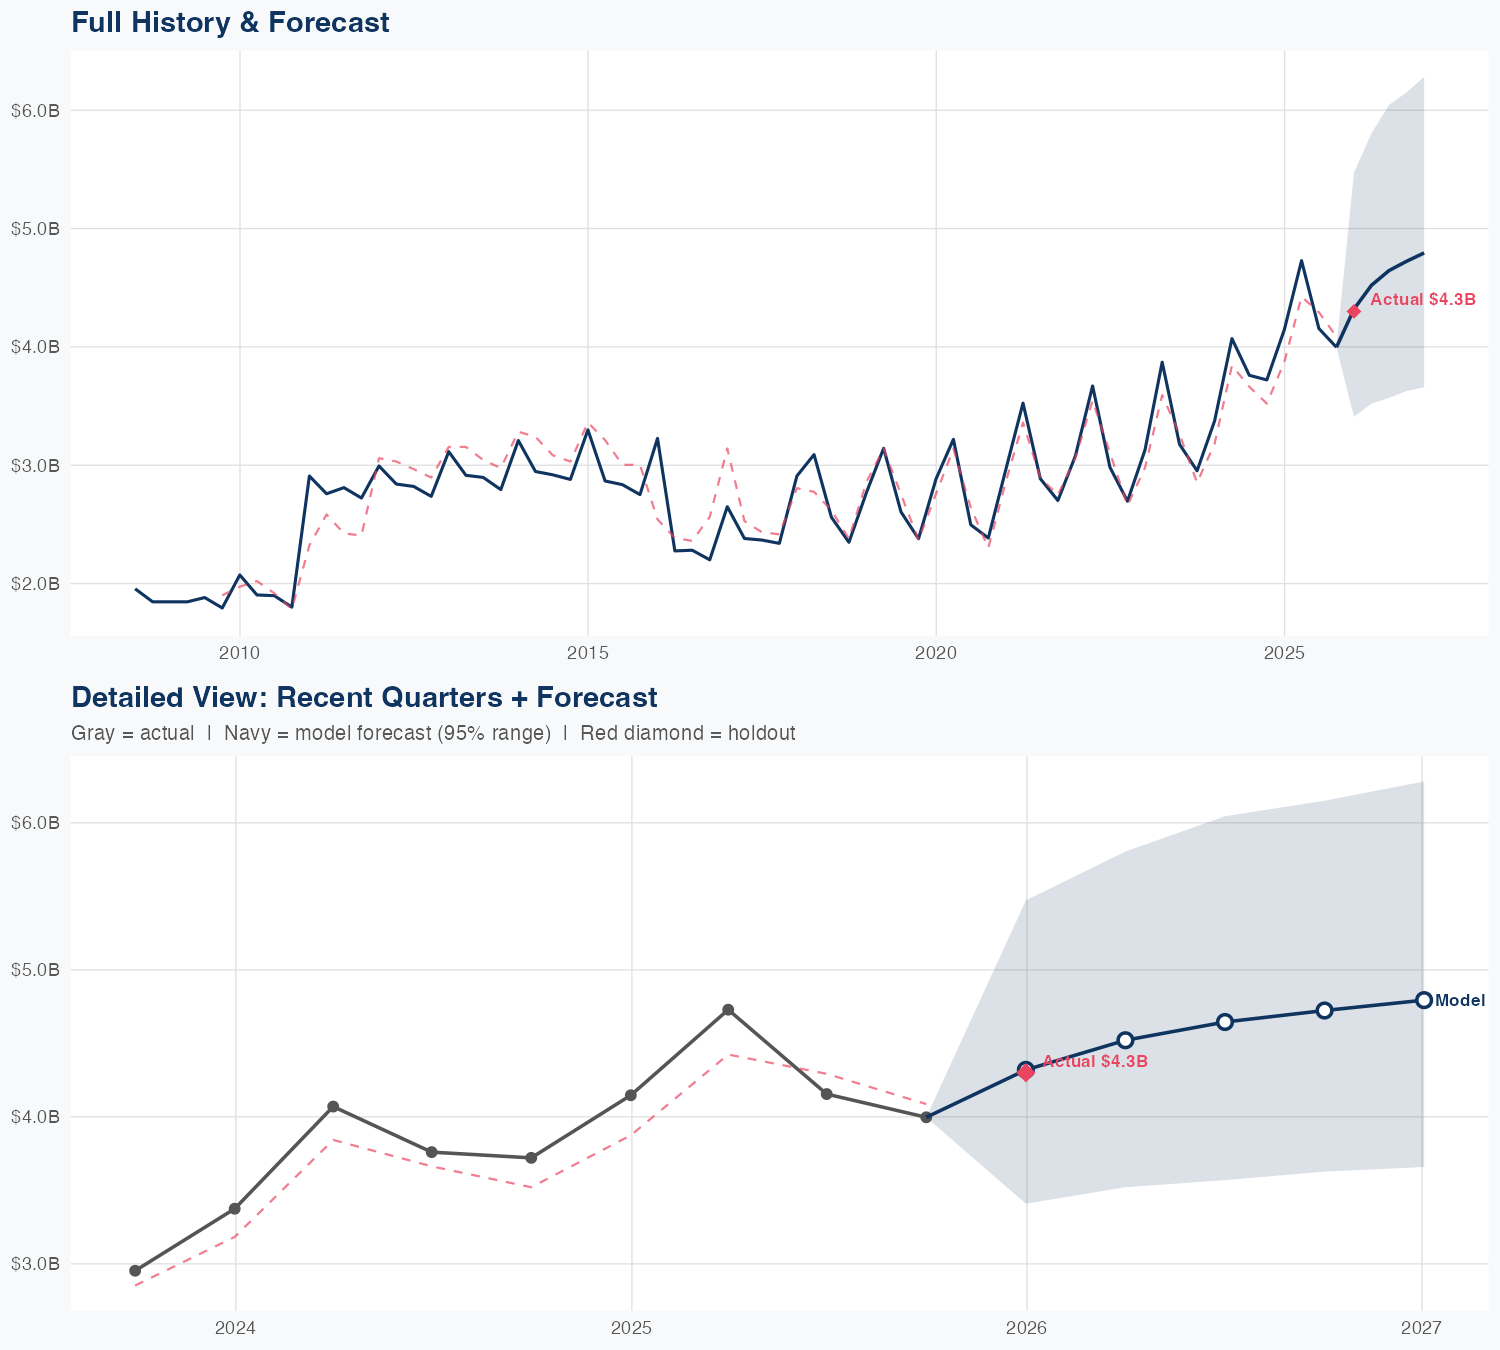
Quarterly Detail
| Quarter | Model Forecast | Actual | 95% Range | YoY Growth | Status |
|---|---|---|---|---|---|
| Q4 2025 | $4.3B | $4.3B | $3.4B – $5.5B | +4.2% | ✓ In range |
| Q2 2026 | $4.5B | $3.5B – $5.8B | -4.4% | ||
| Q3 2026 | $4.6B | $3.6B – $6.0B | +11.8% | ||
| Q4 2026 | $4.7B | $3.6B – $6.2B | +18.2% | ||
| Q1 2027 | $4.8B | $3.7B – $6.3B | +11.5% |
Seasonal Factors
| Fiscal Quarter | Seasonal Factor | vs Trend | Interpretation | Obs. |
|---|---|---|---|---|
| FQ1 (Sep–Nov) | 0.983 | -1.7% | In line with trend | 17 |
| FQ2 (Dec–Feb) | 1.0362 | +3.6% | +3.6% above trend | 17 |
| FQ3 (Mar–May) | 1.0256 | +2.6% | In line with trend | 16 |
| FQ4 (Jun–Aug) | 0.9679 | -3.2% | -3.2% below trend | 16 |
How Spending Drives Revenue
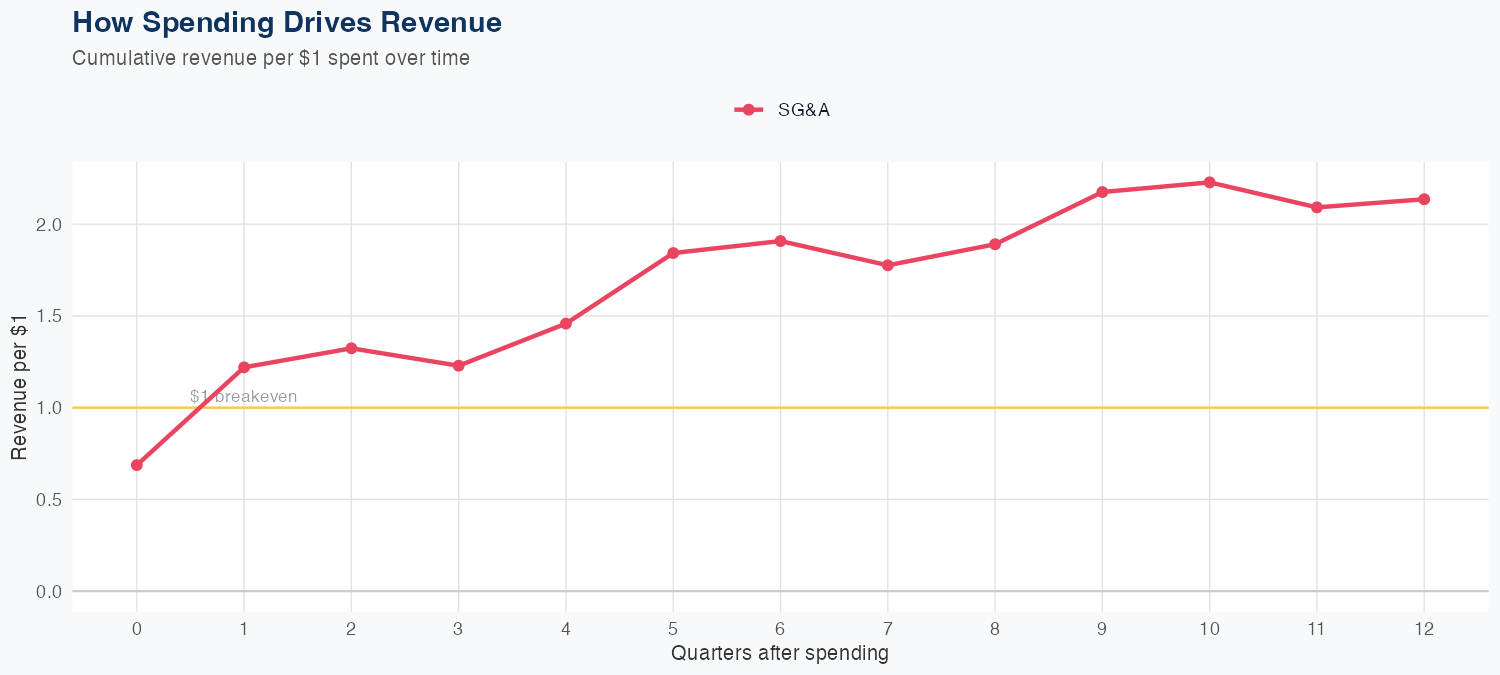
Spending Efficiency Over Time
Current SG&A multiplier: 0.1212
Want this analysis for your portfolio?
I build custom revenue intelligence reports for investors and companies using SEC filing data, econometric modeling, and AI-powered insights.
Get in Touch