Api Group Corporation APG
Revenue Intelligence Report • 27 quarters of SEC filing data • Updated 2026-03-15
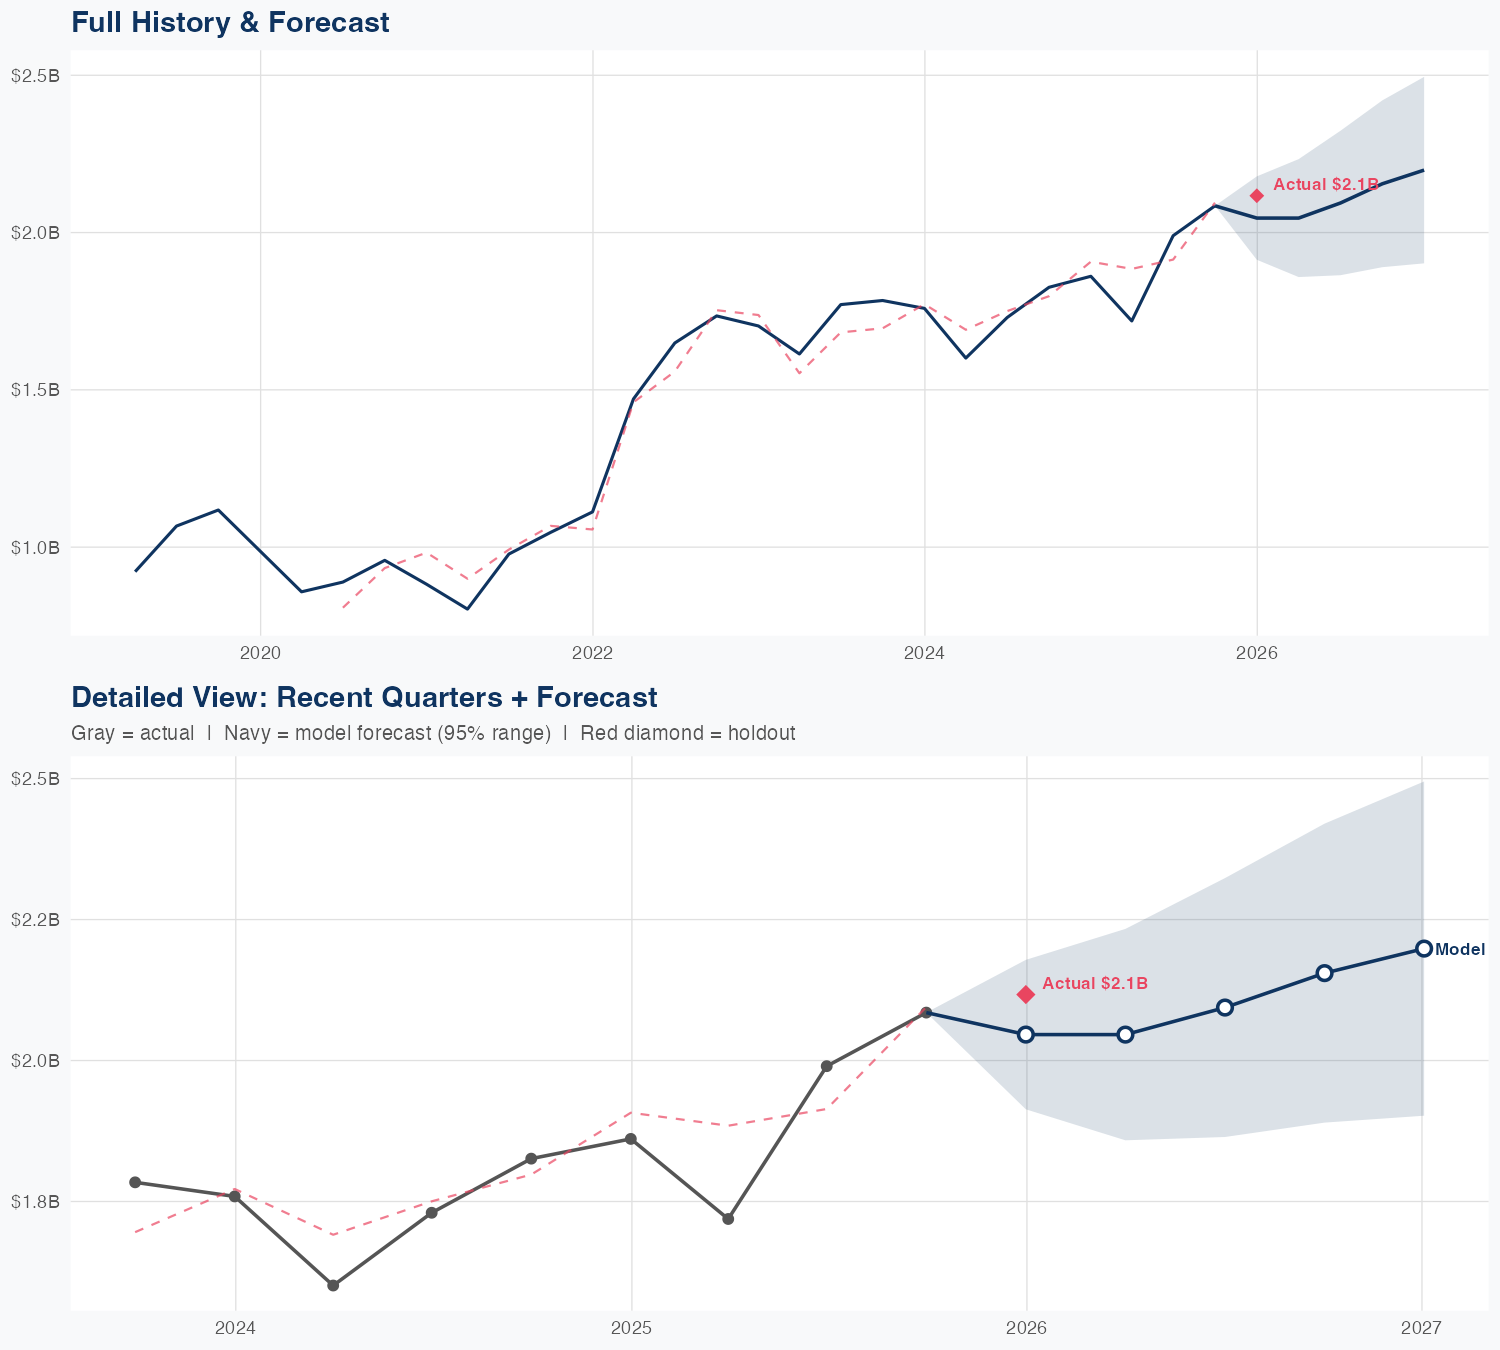
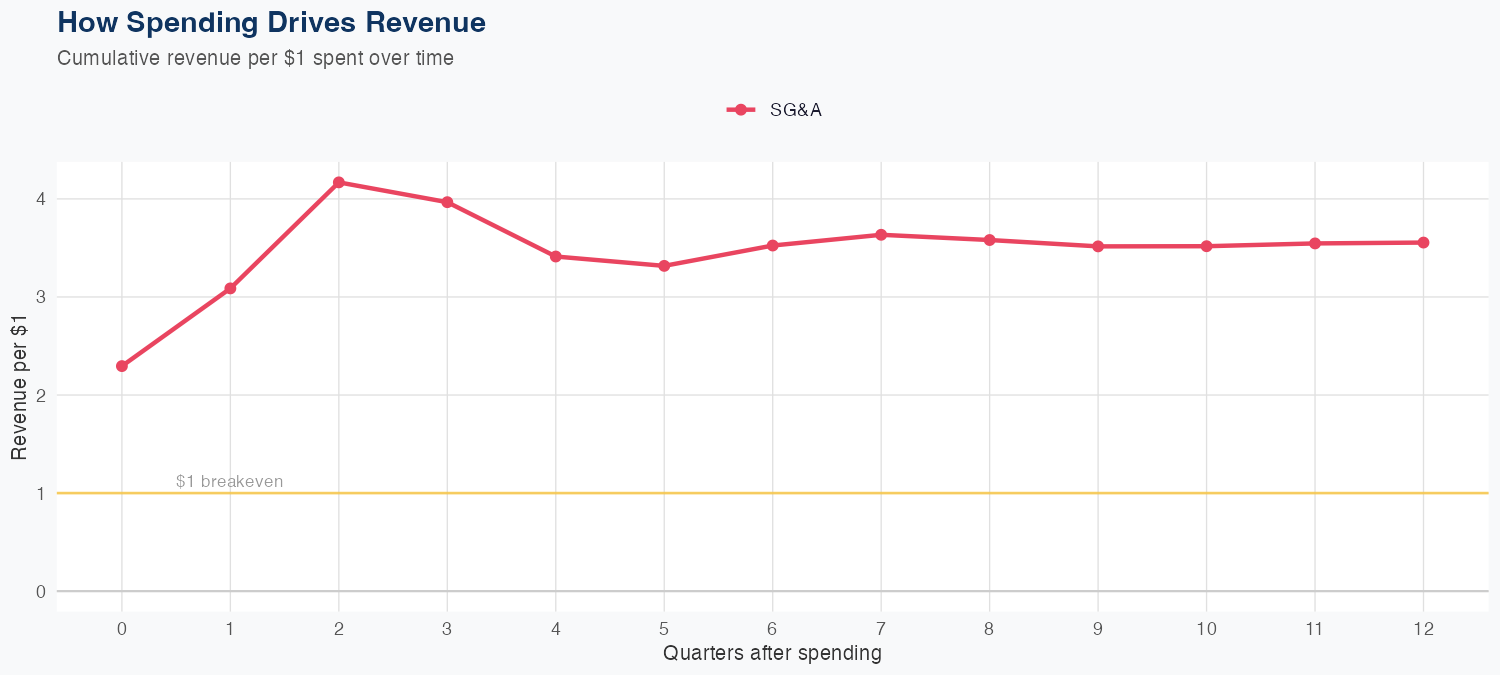
Revenue growth is driven by strong operating leverage from SG&A spending, with every dollar of SG&A generating about $3.55 in long-run revenue, indicating a robust ROI on overhead. The revenue model is linear, built on 27 quarters of data, with a 4.1% MAPE; holdout testing shows the model forecast $2.00B versus $2.10B actual (3.4% error), signaling reliable near-term projections. The latest quarterly revenue was $2.117B, aligned with the model’s near-term outlook and the ongoing trend. The FY forecast is $8.5B in revenue, up 7.4% year over year, pointing to a continued growth trajectory reinforced by efficient spending and strong revenue generation.
Investment Thesis
The econometric model achieves strong accuracy (4.1% MAPE), suggesting Api Group Corporation's revenue trajectory is well-characterized by its spending patterns. Each $1 of SG&A spending generates $3.55 in revenue, reflecting strong commercial efficiency.
Revenue Forecast
Quarterly Detail
| Quarter | Model Forecast | Actual | 95% Range | YoY Growth | Status |
|---|---|---|---|---|---|
| Q4 2025 | $2.0B | $2.1B | $1.9B – $2.2B | +9.9% | ✓ In range |
| Q2 2026 | $2.0B | $1.9B – $2.2B | +19.0% | ||
| Q3 2026 | $2.1B | $1.9B – $2.3B | +5.2% | ||
| Q4 2026 | $2.2B | $1.9B – $2.4B | +3.4% | ||
| Q1 2027 | $2.2B | $1.9B – $2.5B | +3.9% |
Seasonal Factors
| Fiscal Quarter | Seasonal Factor | vs Trend | Interpretation | Obs. |
|---|---|---|---|---|
| FQ1 (Sep–Nov) | 1.0157 | +1.6% | In line with trend | 6 |
| FQ2 (Dec–Feb) | 0.9926 | -0.7% | In line with trend | 6 |
| FQ3 (Mar–May) | 0.9468 | -5.3% | -5.3% below trend | 5 |
| FQ4 (Jun–Aug) | 1.0525 | +5.2% | +5.2% above trend | 6 |
How Spending Drives Revenue
Want this analysis for your portfolio?
I build custom revenue intelligence reports for investors and companies using SEC filing data, econometric modeling, and AI-powered insights.
Get in Touch