Atmos Energy Corp ATO
Revenue Intelligence Report • 20 quarters of SEC filing data • Updated 2026-03-15
Revenue is forecast to decline about 4% year over year, with FY revenue around $2.7 billion as growth drivers ease and pricing power remains limited. Our econometric model shows about 55% of the projected revenue movement coming from structural/platform growth, roughly 45% from SG&A spending, and essentially no contribution from R&D. The binding constraint on revenue growth is regulatory ratemaking and rate-base expansion— Atmos’ ability to grow hinges on regulators approving capital investments and rate increases. In practice, improvements depend on rate-case timing and the scope of allowable capital deployment within the approved framework. Key risk: regulatory outcomes that cap rate-base growth or reduce allowed returns could materially limit upside and pressure shareholder value.
Investment Thesis
The econometric model achieves strong accuracy (6.3% MAPE), suggesting Atmos Energy Corp's revenue trajectory is well-characterized by its spending patterns.
Revenue Forecast
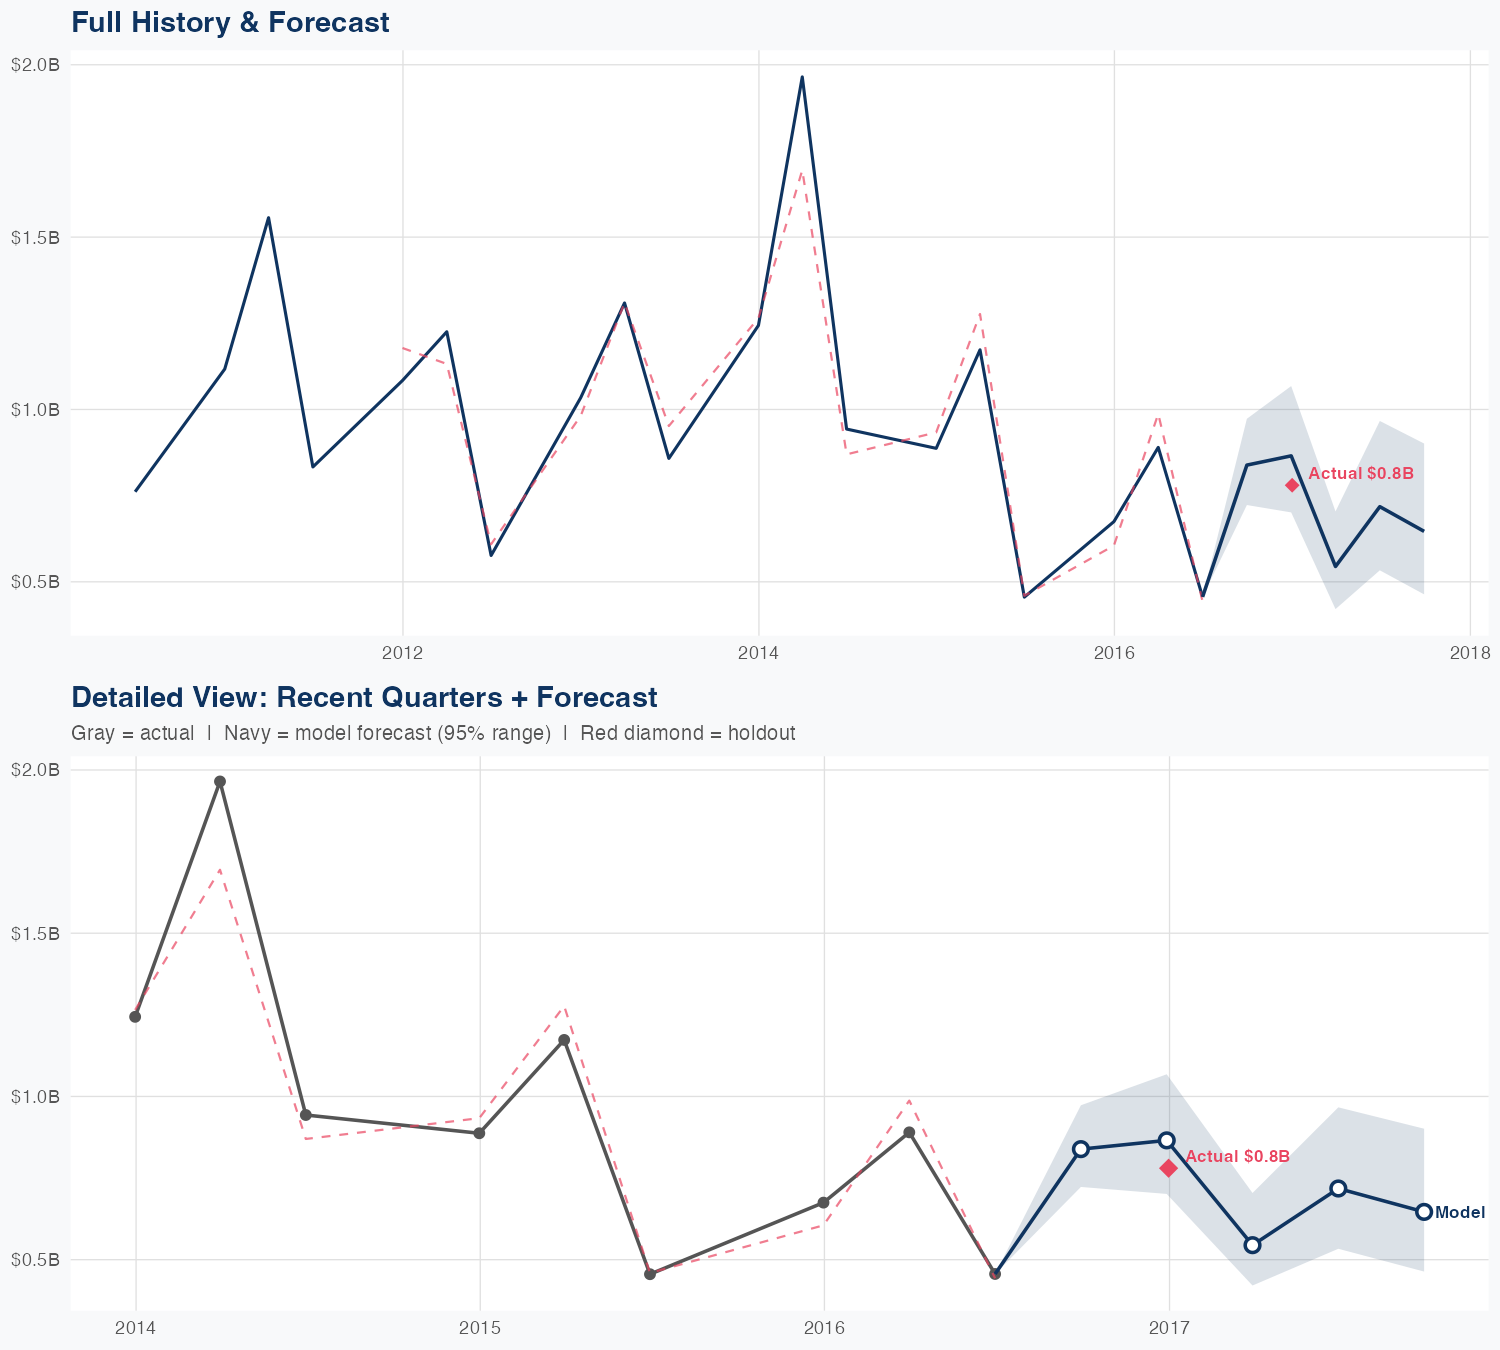
Quarterly Detail
| Quarter | Model Forecast | Actual | 95% Range | YoY Growth | Status |
|---|---|---|---|---|---|
| Q3 2016 | $0.9B | $0.8B | $0.7B – $1.0B | +90.2% | ✓ In range |
| Q4 2016 | $0.7B | $0.6B – $0.9B | +4.2% | ||
| Q1 2017 | $0.7B | $0.5B – $0.9B | -22.5% | ||
| Q2 2017 | $0.7B | $0.5B – $0.9B | +43.1% | ||
| Q3 2017 | $0.6B | $0.5B – $0.9B | -18.8% |
Seasonal Factors
| Fiscal Quarter | Seasonal Factor | vs Trend | Interpretation | Obs. |
|---|---|---|---|---|
| FQ1 (Sep–Nov) | 1.0 | +0.0% | In line with trend | 0 |
| FQ2 (Dec–Feb) | 1.0087 | +0.9% | In line with trend | 6 |
| FQ3 (Mar–May) | 0.9995 | -0.1% | In line with trend | 5 |
| FQ4 (Jun–Aug) | 0.9916 | -0.8% | In line with trend | 5 |
How Spending Drives Revenue
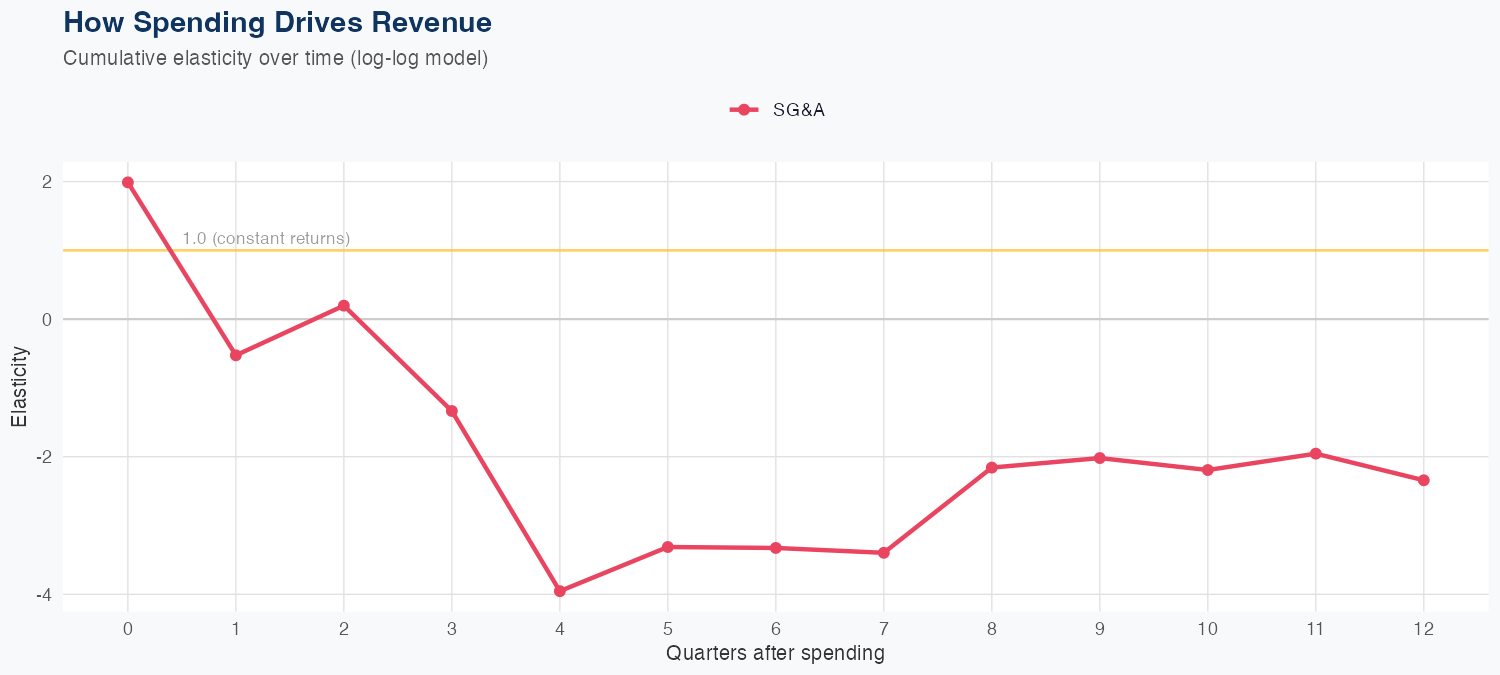
Spending Efficiency Over Time
Current SG&A elasticity: -3.0347x
Want this analysis for your portfolio?
I build custom revenue intelligence reports for investors and companies using SEC filing data, econometric modeling, and AI-powered insights.
Get in Touch