Avalonbay Communities, inc. AVB
Revenue Intelligence Report • 70 quarters of SEC filing data • Updated 2026-03-15
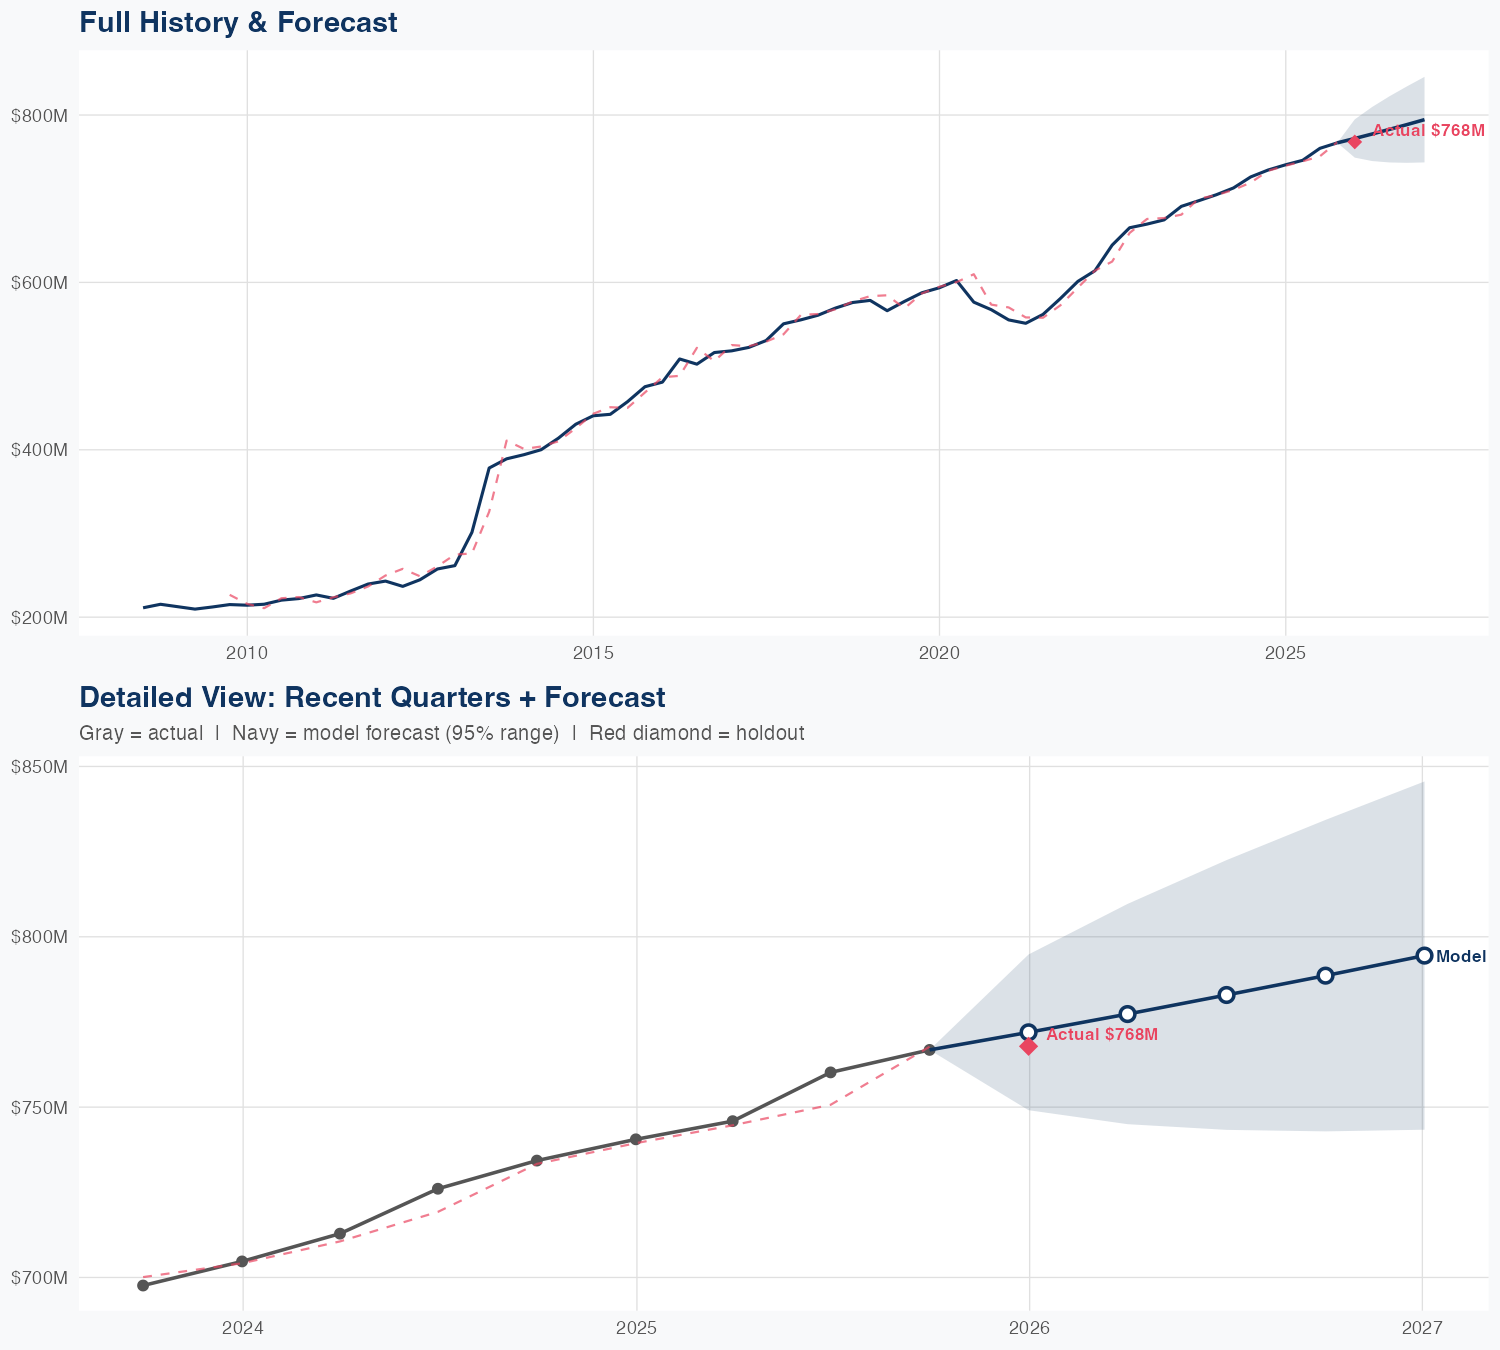
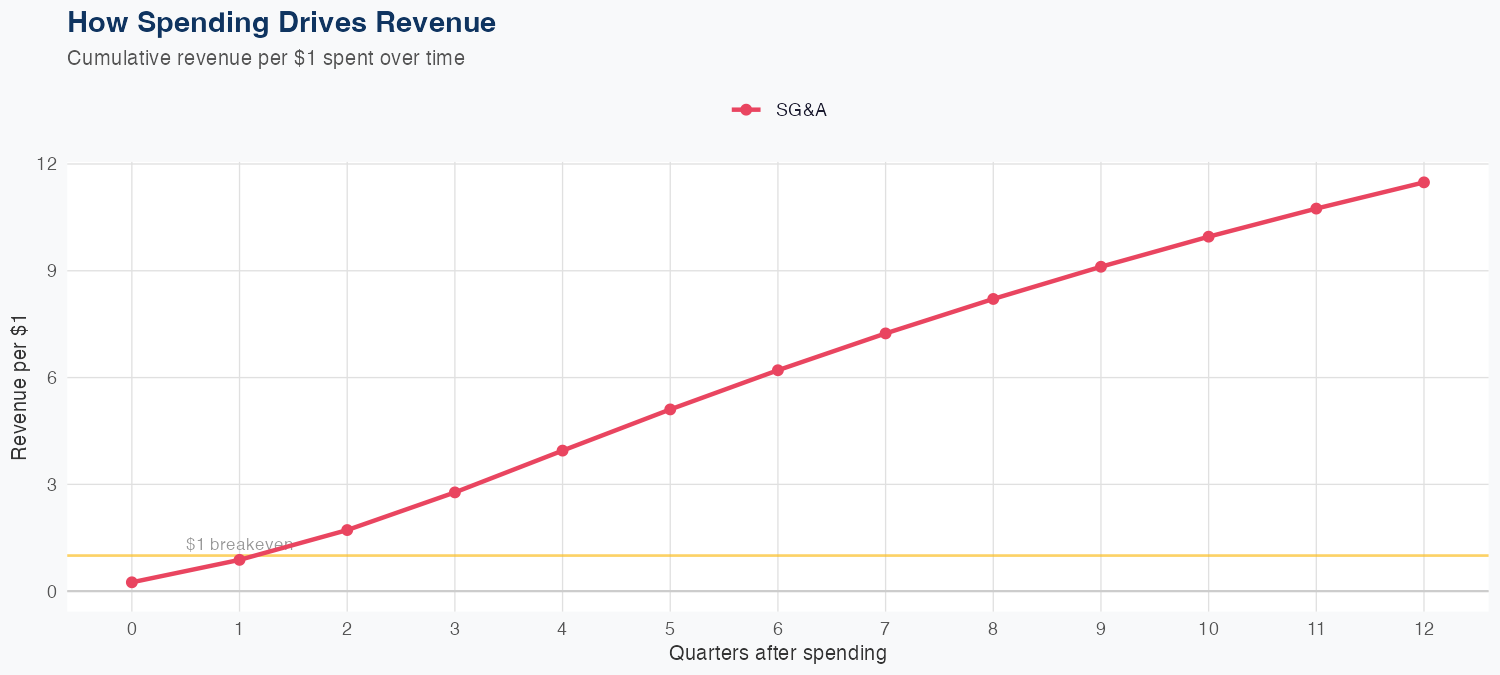
Revenue is driven by occupancy and rent realization in the apartment portfolio, with a strong return on SG&A spending: every $1 of SG&A is modeled to generate $11.48 in long-run revenue. The linear model trained on 70 quarters shows 1.9% MAPE accuracy, and a holdout test predicted $772M versus actual $768M, a -0.5% error, indicating solid near-term predictive reliability. The FY revenue forecast is $3,143M, up 3.4% year over year, signaling a modest yet steady growth trajectory. With no R&D input data, the outlook hinges on operating metrics—occupancy, rent dynamics, and SG&A efficiency—to support continued revenue expansion.
Investment Thesis
Our ARDL model tracks Avalonbay Communities, inc.'s revenue with exceptional precision (1.9% MAPE), indicating highly predictable cash flows. Each $1 of SG&A spending generates $11.48 in revenue, reflecting strong commercial efficiency.
Revenue Forecast
Quarterly Detail
| Quarter | Model Forecast | Actual | 95% Range | YoY Growth | Status |
|---|---|---|---|---|---|
| Q4 2025 | $772B | $768B | $749B – $795B | +4.2% | ✓ In range |
| Q2 2026 | $777B | $745B – $810B | +4.2% | ||
| Q3 2026 | $783B | $743B – $823B | +3.0% | ||
| Q4 2026 | $789B | $743B – $834B | +2.8% | ||
| Q1 2027 | $794B | $743B – $846B | +3.5% |
Seasonal Factors
| Fiscal Quarter | Seasonal Factor | vs Trend | Interpretation | Obs. |
|---|---|---|---|---|
| FQ1 (Sep–Nov) | 1.0013 | +0.1% | In line with trend | 17 |
| FQ2 (Dec–Feb) | 0.9913 | -0.9% | In line with trend | 17 |
| FQ3 (Mar–May) | 0.9975 | -0.3% | In line with trend | 16 |
| FQ4 (Jun–Aug) | 1.0094 | +0.9% | In line with trend | 16 |
How Spending Drives Revenue
Want this analysis for your portfolio?
I build custom revenue intelligence reports for investors and companies using SEC filing data, econometric modeling, and AI-powered insights.
Get in Touch