BOX · Company analysis
Box, Inc.
Box reported $321.1 million of revenue in Q2 FY2027, up 9.2% year over year. This analysis combines 50 quarters of SEC revenue history with a Bayesian outlook and management guidance. The first estimate covers the already-ended October 2026 quarter, whose results were not yet reported as of this review.
EPS surprise outlook · quarter ending 2026-10-31
Upside scenario; no reliable surprise signal
The adjusted EPS median is $0.059 above consensus, smaller than the $0.068 average absolute one-quarter model error. Consensus sits inside the 80% model range. With only seven historical checks, this does not establish a reliable beat or miss signal.
See surprise scenarios and sensitivities ↓ · Inspect historical errors ↓
How the five models connect: Revenue − operating costs → operating income → common earnings after other income, taxes and deductions. Common earnings ÷ modeled shares → EPS. The calculation runs on each simulated path.
Steady revenue growth and stronger operating margins
Net retention reached 106%, while remaining performance obligations grew 15% to $1.7 billion. These measures support the expansion story, but contracted future business is not the same as revenue recognized this quarter.
GAAP operating margin was 10.2%, compared with 29.4% on an adjusted basis. Stock compensation and other exclusions explain why those profitability measures differ. Foreign exchange also matters: reported revenue grew 9%, versus 11% in constant currency. The model uses reported USD revenue and does not isolate AI demand or currency effects.
Quarterly earnings release and reconciliations.
Management’s outlook
On August 25, 2026, Box projected approximately $329M of Q3 FY2027 revenue and $1.290B for full-year FY2027. These are management point estimates, not probability ranges. FY2027 ends January 31, 2027.
For the October 31, 2026 quarter, the independent model’s median is $332.1M, 0.9% above management’s $329M estimate. That guidance point is inside the model’s 80% predictive interval ($323.8M–$340.3M). The quarter had ended before this model was computed; the estimate remains unscored until results are released.
Module 1 of 5
1 · Revenue model
Box, Inc.: possible revenue paths
Latest verified revenue: $321.15M for the quarter ended 2026-07-31. Reported source.
Forecasts are conditional on the listed data cutoff. Sources were refreshed for this model run on 2026-11-08; the cutoff above identifies the latest verified revenue observation included in the fit. Some forecast quarters may already have ended by the computation date. Read each target date before treating an estimate as a future-quarter outlook.
PyMC seasonal AR(1) quarterly log-revenue growth with Student-t shocks; posterior predictive paths include parameter uncertainty and new shocks at every horizon.

Each line is one possible future revenue path. The 80% and 95% intervals are pointwise model probabilities, not simultaneous coverage for the whole path. The median is not an expected dollar mean. Open full-size chart.
| Quarter ending | Predictive median | 80% predictive interval | 95% predictive interval |
|---|---|---|---|
| 2026-10-31 | $332.07M | $323.79M–$340.34M | $317.70M–$346.56M |
| 2027-01-31 | $343.99M | $327.05M–$361.41M | $316.09M–$374.28M |
| 2027-04-30 | $348.98M | $322.68M–$376.42M | $307.35M–$396.80M |
| 2027-07-31 | $366.65M | $330.03M–$406.01M | $309.28M–$434.67M |
Company context
In the 16 retrospective outcomes, holding the last reported revenue constant had lower average percentage error at every horizon than the Bayesian median. This model has not demonstrated an accuracy improvement over that simple baseline. The historical sample is small.
Future period-end dates are approximate: month-end issuers retain month-end dates; weekly issuers advance by 13 weeks. Future 53-week adjustments are not known.
Historical forecast checks
Each historical cutoff refits the model using only earlier observations. Across the available outcomes, the 80% intervals covered 14/16 and the 95% intervals covered 16/16. Small samples and overlapping outcomes do not establish nominal coverage; covering every outcome can indicate overly wide intervals.
| Horizon | Cases | Bayesian median MAPE | Last reported revenue MAPE | Same quarter last year MAPE | 80% covered | 95% covered |
|---|---|---|---|---|---|---|
| 1 quarter | 4 | 1.83% | 1.53% | 7.09% | 3/4 | 4/4 |
| 2 quarters | 4 | 3.68% | 2.98% | 6.50% | 3/4 | 4/4 |
| 3 quarters | 4 | 5.83% | 2.43% | 6.02% | 4/4 | 4/4 |
| 4 quarters | 4 | 6.46% | 6.42% | 6.42% | 4/4 | 4/4 |
All point-forecast errors use the same historical cases. A simple baseline may have lower error than the Bayesian median; this rollout does not establish that the Bayesian model is superior for every company.
Up to four historical cutoffs spaced four quarters apart, with at least 16 training quarters; full four-quarter outcomes required. Fixed specification, no winner selection.
These are retrospective checks using latest-restated data, not forecasts archived before their outcomes. Results from DDOG or another company are not transferred to this company.
Sampling diagnostics and limitations
Maximum R-hat 1.002 · minimum bulk ESS 2381 · minimum tail ESS 1394 · divergent transitions 0. The required sampling checks passed. These diagnose computation, not predictive calibration.
Fixed priors
mu is long-run quarterly log growth; phi is growth persistence; sigma is the shock scale; season gives quarterly effects; shock_df controls tail thickness.
| Parameter | Prior / fixed assumption |
|---|---|
| mu | Normal(0,0.10) |
| phi | Normal(0,0.5) truncated to [-0.98,0.98] |
| sigma | HalfNormal(0.10) |
| season | 4 Normal(0,0.15), centered to sum zero |
| shock_df | 5 |
Future regime changes and uncertainty over alternative model structures remain outside these intervals. The model should be scored on subsequent releases, and its forecast vintage preserved.
- Revenue-history baseline; does not identify customer-level discounts, acquisitions or future structural breaks.
- Intervals are pointwise, conditional on this model and priors, not guaranteed coverage or simultaneous path bounds.
- Latest-restated historical data; retrospective tests are not archived real-time forecasts. Small test samples cannot validate nominal coverage.
- Student-t log shocks can make dollar means undefined; point forecasts are medians.
- SEC and/or company-reported sources were checked on the displayed date. Source-period cutoffs differ by issuer; explicit coverage notes identify unresolved newer-release checks.
Revenue expectations beside the model
Quarter ending 2026-10-31. Analyst estimates and management guidance remain independent comparisons; they do not enter the revenue fit.
| Model median | Analyst consensus | Management |
|---|---|---|
| $332.1M | $329.2M | $329.0M |
Historical revenue: model, analysts and reported results
| Quarter ended | Model median | Analyst consensus | Reported |
|---|---|---|---|
| 2026-07-31 | $318.1M | $319.3M | $321.1M |
| 2026-04-30 | $305.9M | $304.4M | $305.9M |
| 2026-01-31 | $310.4M | $305.6M | $305.9M |
| 2025-07-31 | $283.9M | $290.2M | $294.0M |
| 2025-04-30 | $279.4M | $274.8M | $276.3M |
Module 2 of 5
2 · Cost model
Operating costs include cost of revenue plus operating expenses. Their growth responds to simulated revenue growth, recent cost trends and the quarter of the year. Adjusted costs equal revenue less company-reported adjusted operating income.
Reported 2026-07-31Adjusted operating costs: $226.6M
Reported 2026-07-31
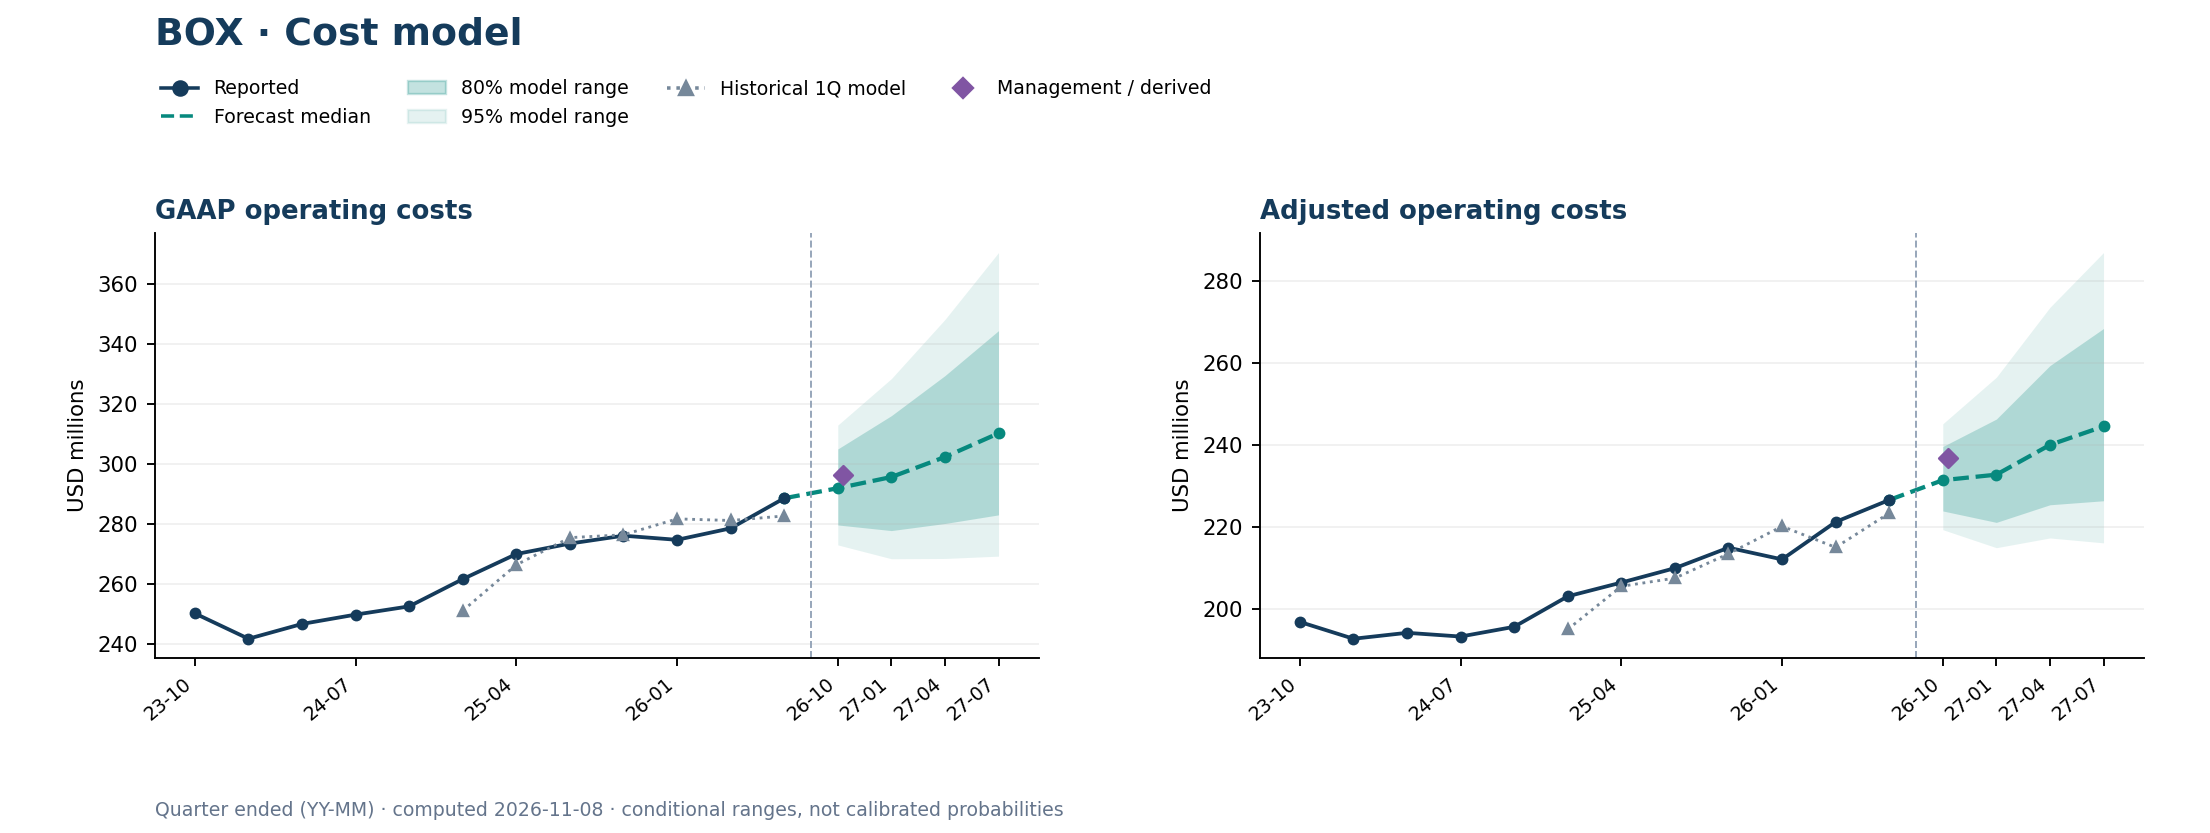
Open full-size chart. Last 12 reported quarters are plotted; all 19 aligned quarters appear below. The vertical line separates reported history from model predictions. Historical model points use earlier quarters only. Shaded ranges are conditional simulations and have not been calibrated to real-world probabilities.
Next target: 2026-10-31
| Measure | Model median | Management / derived | Analyst consensus |
|---|---|---|---|
| GAAP operating costs | $291.9M | $296.1M (derived) | Not available |
| Adjusted operating costs | $231.5M | $236.9M (derived) | Not available |
Four-quarter predictions
| Quarter ending | Measure | Median | 80% model range | 95% model range |
|---|---|---|---|---|
| 2026-10-31 | GAAP operating costs | $291.9M | $279.6M to $304.9M | $273.0M to $312.9M |
| 2026-10-31 | Adjusted operating costs | $231.5M | $224.0M to $239.7M | $219.4M to $245.2M |
| 2027-01-31 | GAAP operating costs | $295.6M | $277.7M to $316.0M | $268.4M to $328.4M |
| 2027-01-31 | Adjusted operating costs | $232.8M | $221.2M to $246.4M | $215.0M to $256.6M |
| 2027-04-30 | GAAP operating costs | $302.2M | $280.1M to $329.4M | $268.5M to $348.1M |
| 2027-04-30 | Adjusted operating costs | $240.1M | $225.5M to $259.4M | $217.4M to $273.6M |
| 2027-07-31 | GAAP operating costs | $310.1M | $283.0M to $344.3M | $269.2M to $370.3M |
| 2027-07-31 | Adjusted operating costs | $244.6M | $226.4M to $268.4M | $216.2M to $286.9M |
All 19 quarters of cost model history
| Quarter ended | GAAP operating costs | Adjusted operating costs |
|---|---|---|
| 2026-07-31 | $288.5M | $226.6M |
| 2026-04-30 | $278.5M | $221.3M |
| 2026-01-31 | $274.7M | $212.2M |
| 2025-10-31 | $276.0M | $215.0M |
| 2025-07-31 | $273.4M | $210.0M |
| 2025-04-30 | $269.9M | $206.5M |
| 2025-01-31 | $261.6M | $203.2M |
| 2024-10-31 | $252.5M | $195.7M |
| 2024-07-31 | $249.8M | $193.3M |
| 2024-04-30 | $246.7M | $194.3M |
| 2024-01-31 | $241.7M | $192.8M |
| 2023-10-31 | $250.2M | $196.9M |
| 2023-07-31 | $251.6M | $196.7M |
| 2023-04-30 | $243.6M | $194.5M |
| 2023-01-31 | $236.8M | $189.9M |
| 2022-10-31 | $236.6M | $190.0M |
| 2022-07-31 | $242.9M | $192.7M |
| 2022-04-30 | $237.8M | $189.3M |
| 2022-01-31 | $233.5M | $184.9M |
Module 3 of 5
3 · Earnings model
Each path subtracts operating costs from revenue, then adds the modeled bridge for other income, taxes and common-stockholder deductions. The result is earnings available to common stockholders—the numerator required for EPS.
Adjusted tax accounting changed in FY2026: the company used a 26.8% projected rate, then 25% in FY2027. The adjusted earnings bridge fits the six observed quarters under normalized tax accounting, removes their stated rate and applies the latest 25% rate. Preferred dividends and allocations are included in common earnings; total net income alone would overstate EPS. Company reconciliation and tax policy.
Reported 2026-07-31Adjusted common earnings: $55.6M
Reported 2026-07-31
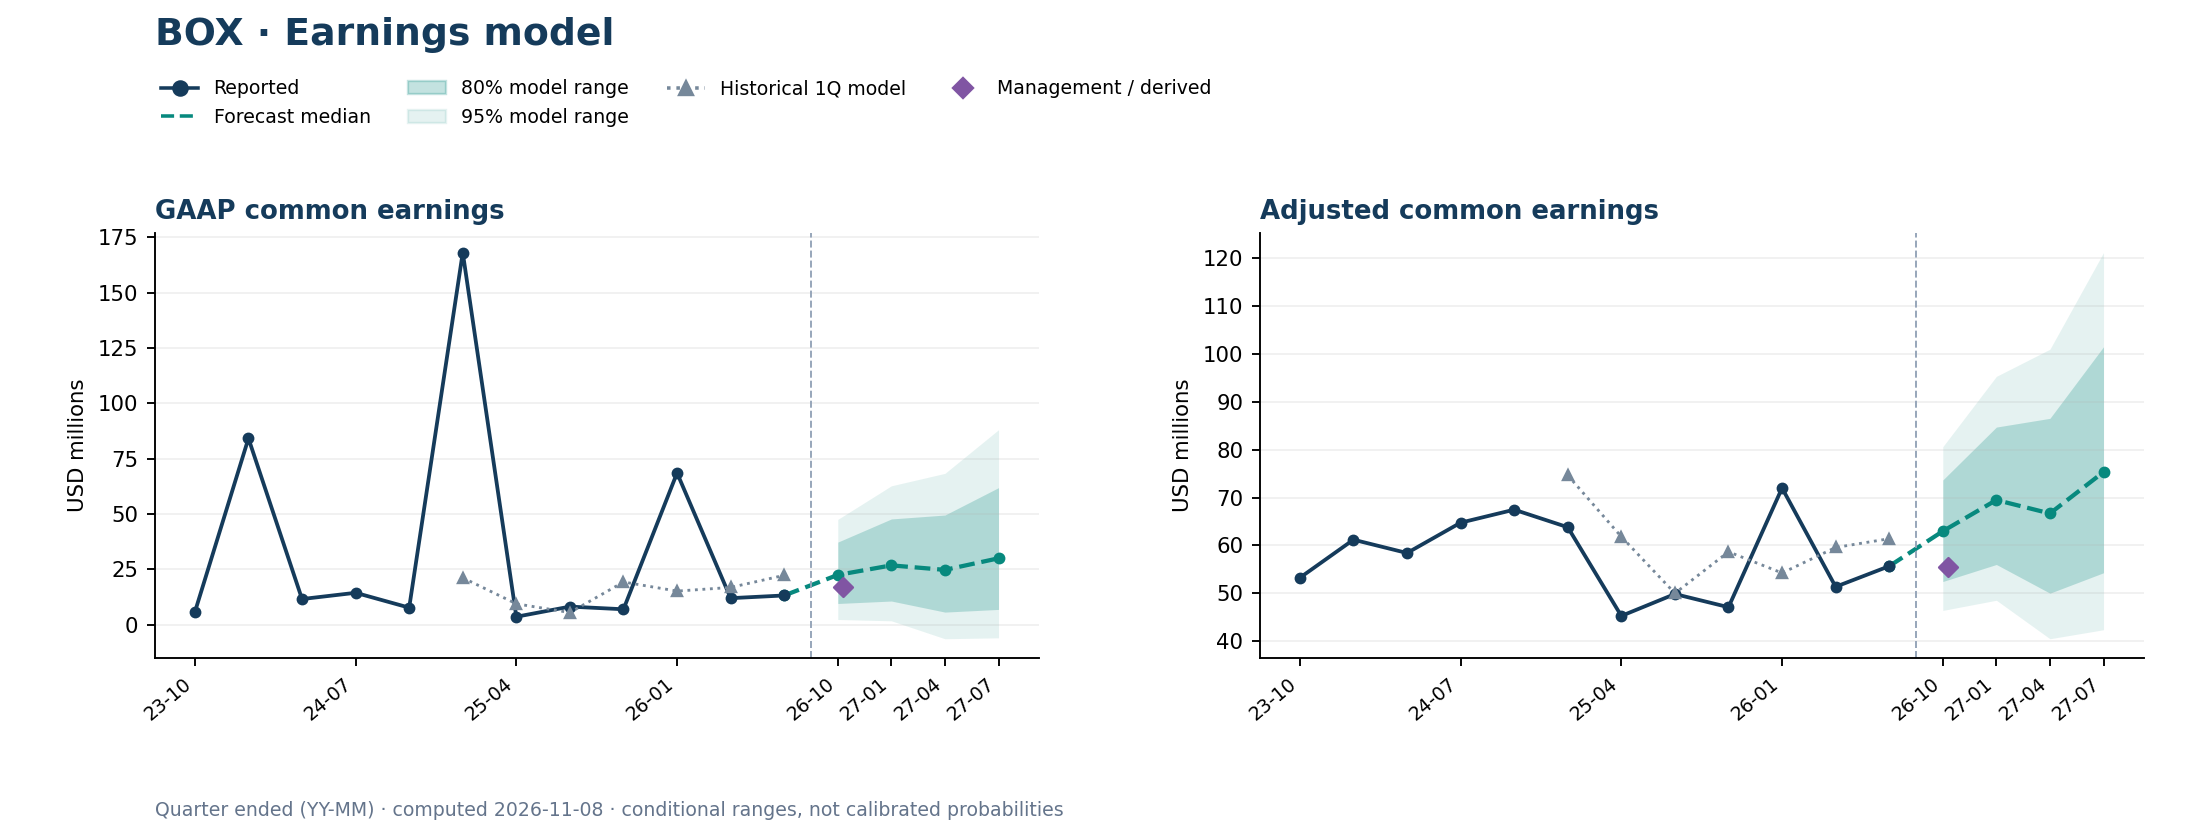
Open full-size chart. Last 12 reported quarters are plotted; all 19 aligned quarters appear below. The vertical line separates reported history from model predictions. Historical model points use earlier quarters only. Shaded ranges are conditional simulations and have not been calibrated to real-world probabilities.
Next target: 2026-10-31
| Measure | Model median | Management / derived | Analyst consensus |
|---|---|---|---|
| GAAP common earnings | $22.4M | $17.0M (derived) | Not available |
| Adjusted common earnings | $63.0M | $55.4M (derived) | Not available |
Four-quarter predictions
| Quarter ending | Measure | Median | 80% model range | 95% model range |
|---|---|---|---|---|
| 2026-10-31 | GAAP common earnings | $22.4M | $9.5M to $37.2M | $2.3M to $47.5M |
| 2026-10-31 | Adjusted common earnings | $63.0M | $52.4M to $73.7M | $46.4M to $80.6M |
| 2027-01-31 | GAAP common earnings | $26.7M | $10.6M to $47.7M | $1.7M to $62.7M |
| 2027-01-31 | Adjusted common earnings | $69.5M | $56.0M to $84.7M | $48.5M to $95.3M |
| 2027-04-30 | GAAP common earnings | $24.7M | $5.6M to $49.5M | −$6.4M to $68.3M |
| 2027-04-30 | Adjusted common earnings | $66.7M | $50.0M to $86.6M | $40.5M to $101.0M |
| 2027-07-31 | GAAP common earnings | $29.9M | $6.8M to $61.8M | −$6.0M to $88.0M |
| 2027-07-31 | Adjusted common earnings | $75.3M | $54.3M to $101.5M | $42.4M to $121.2M |
All 19 quarters of earnings model history
| Quarter ended | GAAP common earnings | Adjusted common earnings |
|---|---|---|
| 2026-07-31 | $13.1M | $55.6M |
| 2026-04-30 | $11.9M | $51.3M |
| 2026-01-31 | $68.5M | $72.0M |
| 2025-10-31 | $6.9M | $47.1M |
| 2025-07-31 | $8.1M | $49.8M |
| 2025-04-30 | $3.5M | $45.2M |
| 2025-01-31 | $168.1M | $63.8M |
| 2024-10-31 | $7.6M | $67.5M |
| 2024-07-31 | $14.3M | $64.7M |
| 2024-04-30 | $11.5M | $58.4M |
| 2024-01-31 | $84.1M | $61.2M |
| 2023-10-31 | $5.6M | $53.2M |
| 2023-07-31 | $5.7M | $54.7M |
| 2023-04-30 | $3.7M | $47.5M |
| 2023-01-31 | $15.1M | $56.3M |
| 2022-10-31 | $5.0M | $46.6M |
| 2022-07-31 | −$3.3M | $41.9M |
| 2022-04-30 | −$8.9M | $35.5M |
| 2022-01-31 | −$8.7M | $36.9M |
Module 4 of 5
4 · Share count model
Weighted-average shares follow a recent trend with uncertainty; potential dilution is modeled separately. Profitable paths use diluted shares. Loss paths use basic shares to avoid treating anti-dilutive securities as EPS dilution. Buybacks, stock compensation and issuance enter through reported share history.
Reported 2026-07-31GAAP diluted shares: 139.7M
Reported 2026-07-31Adjusted diluted shares: 139.7M
Reported 2026-07-31
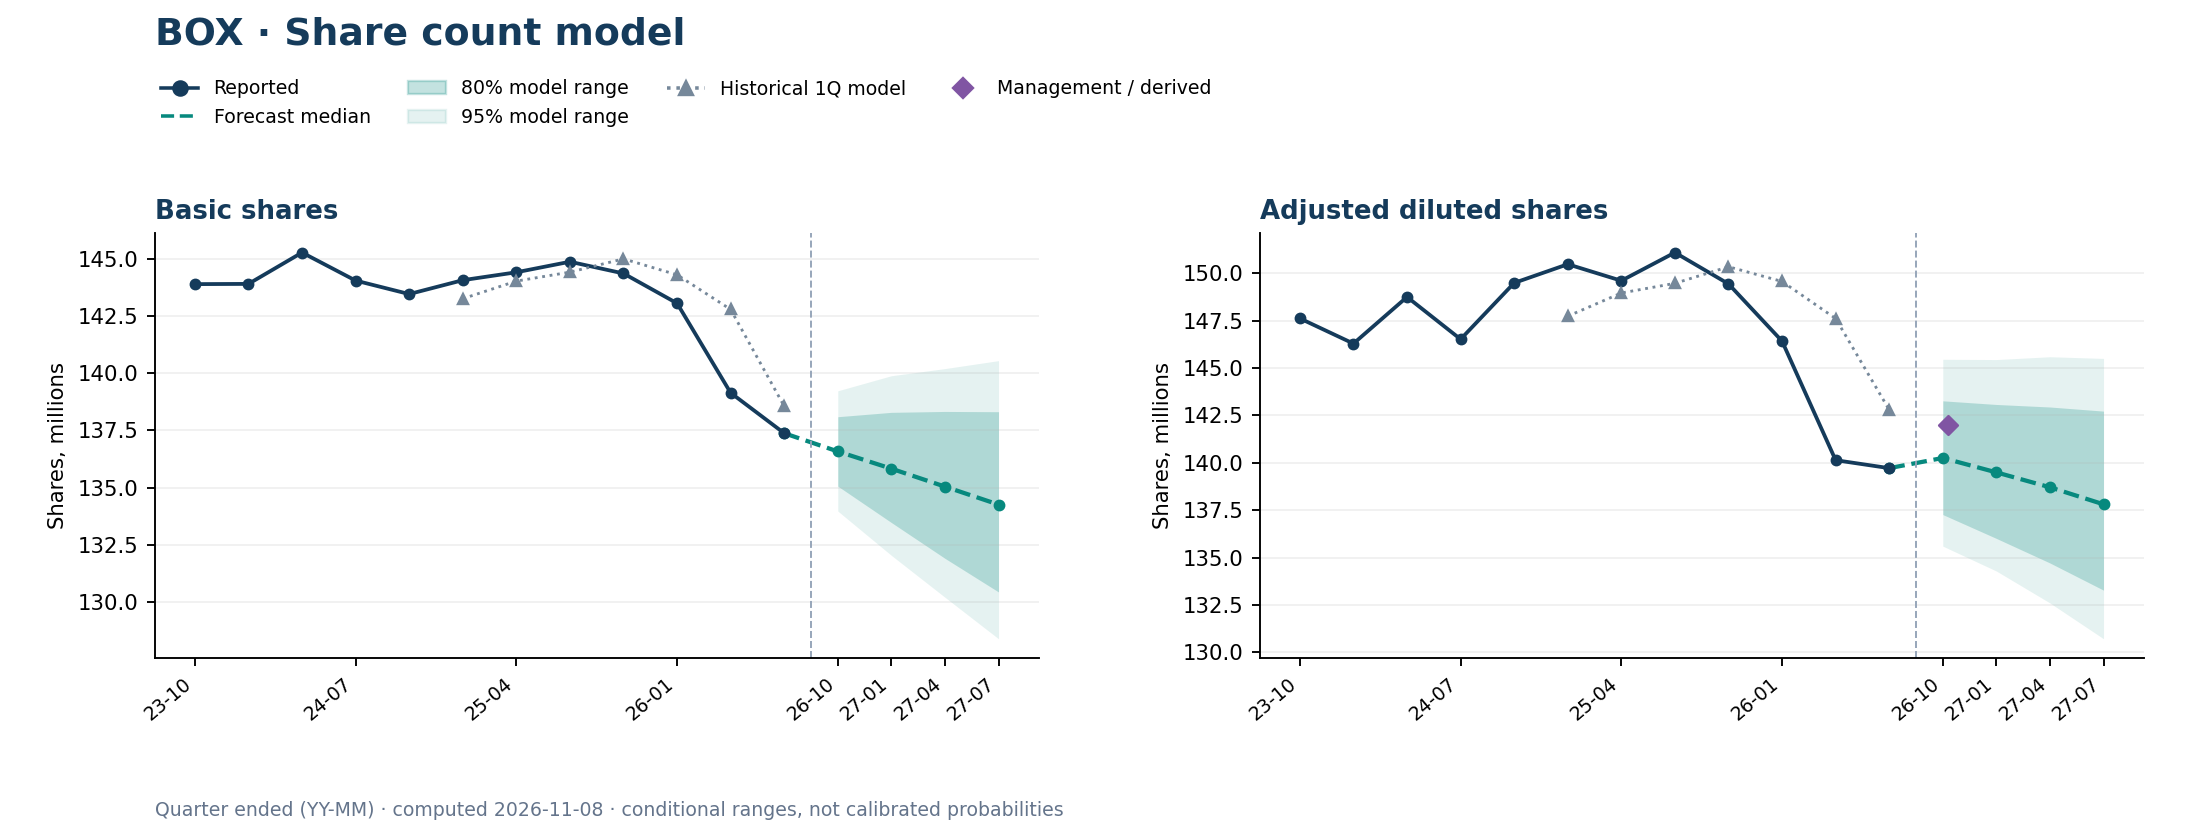
Open full-size chart. Last 12 reported quarters are plotted; all 19 aligned quarters appear below. The vertical line separates reported history from model predictions. Historical model points use earlier quarters only. Shaded ranges are conditional simulations and have not been calibrated to real-world probabilities. The chart shows basic and adjusted diluted shares; the tables also show GAAP diluted shares.
Next target: 2026-10-31
| Measure | Model median | Management / derived | Analyst consensus |
|---|---|---|---|
| Basic shares | 136.6M | Not available | Not available |
| GAAP diluted shares | 140.2M | 142.0M | Not available |
| Adjusted diluted shares | 140.3M | 142.0M | Not available |
Four-quarter predictions
| Quarter ending | Measure | Median | 80% model range | 95% model range |
|---|---|---|---|---|
| 2026-10-31 | Basic shares | 136.6M | 135.1M to 138.1M | 134.0M to 139.2M |
| 2026-10-31 | GAAP diluted shares | 140.2M | 137.1M to 143.2M | 135.4M to 145.4M |
| 2026-10-31 | Adjusted diluted shares | 140.3M | 137.3M to 143.3M | 135.6M to 145.5M |
| 2027-01-31 | Basic shares | 135.8M | 133.5M to 138.3M | 132.0M to 139.9M |
| 2027-01-31 | GAAP diluted shares | 139.4M | 135.8M to 143.0M | 134.0M to 145.4M |
| 2027-01-31 | Adjusted diluted shares | 139.5M | 136.0M to 143.1M | 134.3M to 145.5M |
| 2027-04-30 | Basic shares | 135.0M | 131.9M to 138.3M | 130.2M to 140.2M |
| 2027-04-30 | GAAP diluted shares | 138.5M | 134.4M to 142.8M | 132.1M to 145.5M |
| 2027-04-30 | Adjusted diluted shares | 138.7M | 134.7M to 142.9M | 132.6M to 145.6M |
| 2027-07-31 | Basic shares | 134.3M | 130.4M to 138.3M | 128.4M to 140.6M |
| 2027-07-31 | GAAP diluted shares | 137.7M | 133.0M to 142.6M | 130.4M to 145.4M |
| 2027-07-31 | Adjusted diluted shares | 137.8M | 133.3M to 142.7M | 130.7M to 145.5M |
All 19 quarters of share count model history
| Quarter ended | Basic shares | GAAP diluted shares | Adjusted diluted shares |
|---|---|---|---|
| 2026-07-31 | 137.4M | 139.7M | 139.7M |
| 2026-04-30 | 139.2M | 140.1M | 140.1M |
| 2026-01-31 | 143.1M | 146.4M | 146.4M |
| 2025-10-31 | 144.4M | 149.4M | 149.4M |
| 2025-07-31 | 144.9M | 151.1M | 151.1M |
| 2025-04-30 | 144.4M | 149.6M | 149.6M |
| 2025-01-31 | 144.1M | 150.5M | 150.5M |
| 2024-10-31 | 143.5M | 149.1M | 149.5M |
| 2024-07-31 | 144.1M | 146.5M | 146.5M |
| 2024-04-30 | 145.3M | 148.8M | 148.8M |
| 2024-01-31 | 143.9M | 146.3M | 146.3M |
| 2023-10-31 | 143.9M | 147.6M | 147.6M |
| 2023-07-31 | 144.2M | 150.0M | 150.0M |
| 2023-04-30 | 144.7M | 150.4M | 150.4M |
| 2023-01-31 | 143.6M | 150.5M | 150.5M |
| 2022-10-31 | 142.4M | 148.1M | 148.1M |
| 2022-07-31 | 143.7M | 143.7M | 149.3M |
| 2022-04-30 | 144.7M | 144.7M | 152.8M |
| 2022-01-31 | 148.3M | 148.3M | 156.0M |
Module 5 of 5
5 · EPS model
For every simulated path, EPS equals common earnings divided by the matching weighted-average share count. Revenue, costs, below-operating-income items and shares therefore feed the same EPS distribution. GAAP and adjusted measures remain separate.
Reported 2026-07-31Adjusted diluted EPS: $0.40
Reported 2026-07-31
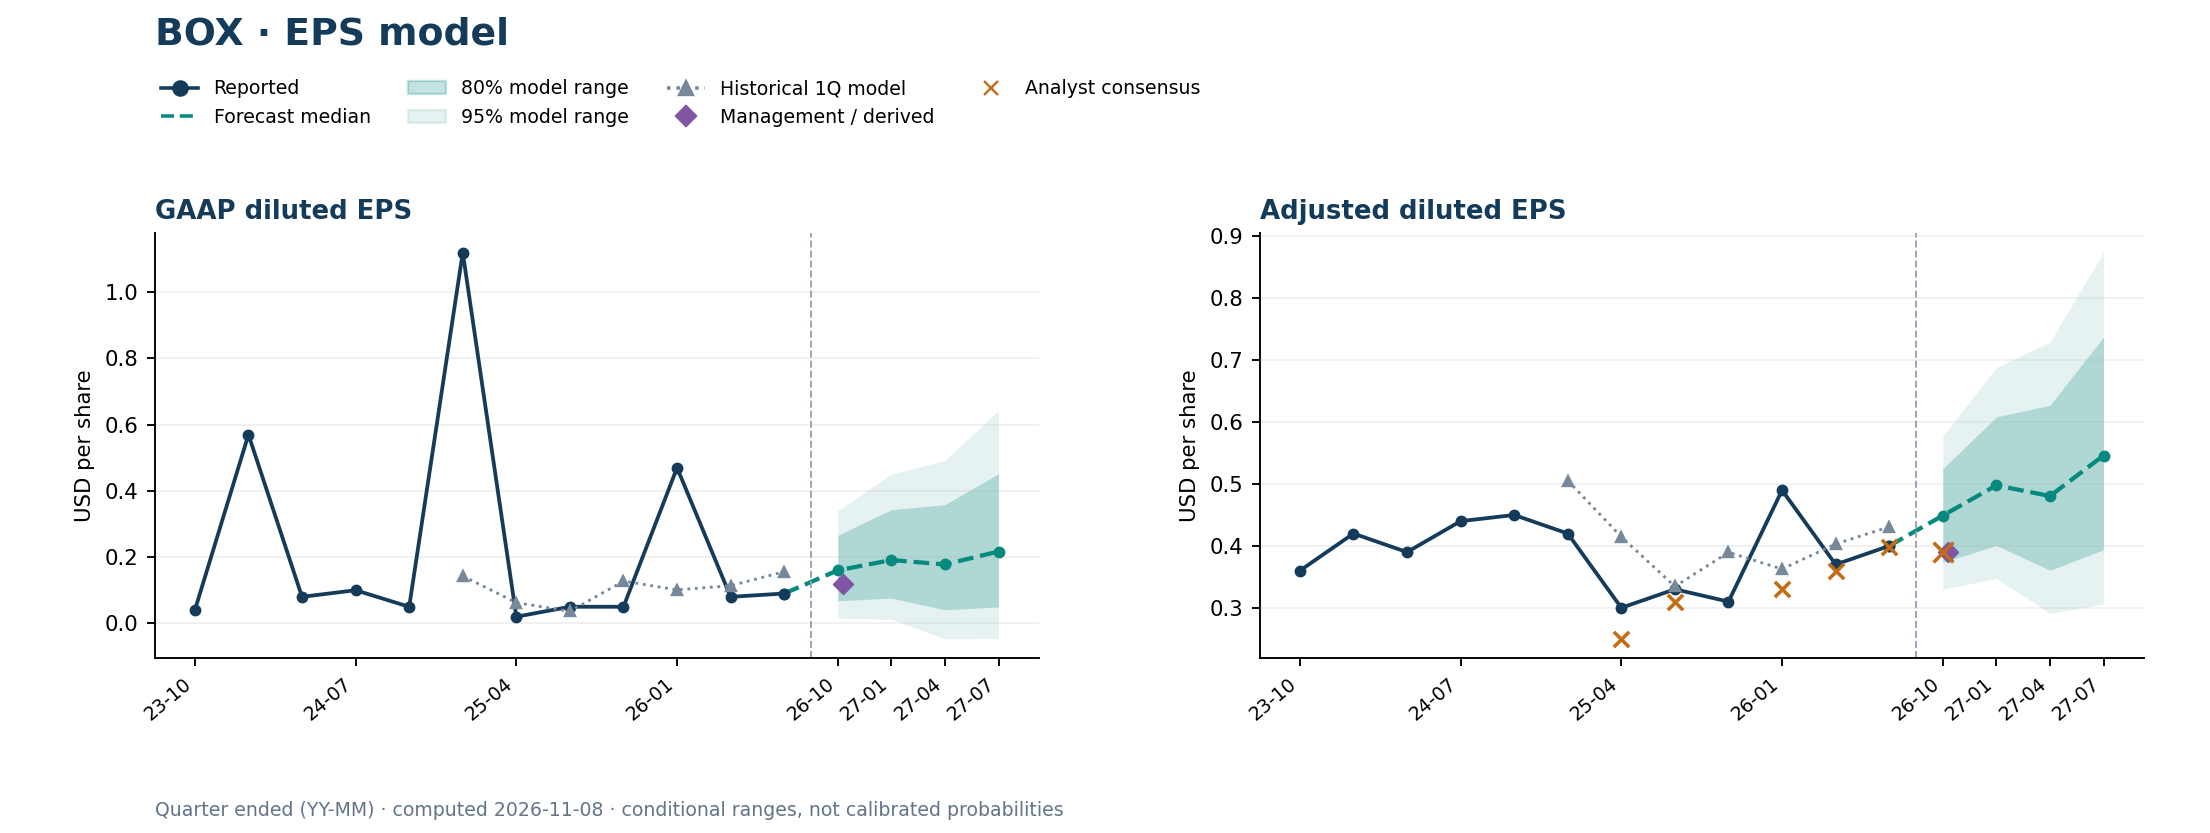
Open full-size chart. Last 12 reported quarters are plotted; all 19 aligned quarters appear below. The vertical line separates reported history from model predictions. Historical model points use earlier quarters only. Shaded ranges are conditional simulations and have not been calibrated to real-world probabilities.
Next target: 2026-10-31
| Measure | Model median | Management / derived | Analyst consensus |
|---|---|---|---|
| GAAP diluted EPS | $0.16 | $0.12 | Not available |
| Adjusted diluted EPS | $0.45 | $0.39 | $0.39 |
Conditional surprise scenarios
These percentages are model scenarios, not calibrated odds. Adjusted EPS: model MAE $0.068, last-quarter baseline MAE $0.076; the nominal 80% range covered 3/7 outcomes. These are reconstructed checks, not archived live forecasts. The adjusted EPS median is $0.059 above consensus, smaller than the $0.068 average absolute one-quarter model error. Consensus sits inside the 80% model range. With only seven historical checks, this does not establish a reliable beat or miss signal.
What would erase the modeled upside?
At consensus EPS, the median break-even adjusted operating-cost level across the simulated revenue, earnings-bridge and share paths is $239.9M, versus a cost-model median of $231.5M. The median cost headroom is $8.3M. Replacing next-quarter revenue with analyst consensus and rerunning the linked cost response produces a conditional adjusted EPS median of $0.44.
| Sensitivity | EPS change |
|---|---|
| Operating costs +1% (earnings bridge held fixed) | −$0.017 |
| Below-operating-income contribution −$5M | −$0.036 |
| Diluted shares +1% (earnings held fixed) | −$0.004 |
Four-quarter predictions
| Quarter ending | Measure | Median | 80% model range | 95% model range |
|---|---|---|---|---|
| 2026-10-31 | GAAP diluted EPS | $0.16 | $0.07 to $0.27 | $0.02 to $0.34 |
| 2026-10-31 | Adjusted diluted EPS | $0.45 | $0.37 to $0.52 | $0.33 to $0.58 |
| 2027-01-31 | GAAP diluted EPS | $0.19 | $0.08 to $0.34 | $0.01 to $0.45 |
| 2027-01-31 | Adjusted diluted EPS | $0.50 | $0.40 to $0.61 | $0.35 to $0.69 |
| 2027-04-30 | GAAP diluted EPS | $0.18 | $0.04 to $0.36 | −$0.05 to $0.49 |
| 2027-04-30 | Adjusted diluted EPS | $0.48 | $0.36 to $0.63 | $0.29 to $0.73 |
| 2027-07-31 | GAAP diluted EPS | $0.22 | $0.05 to $0.45 | −$0.05 to $0.64 |
| 2027-07-31 | Adjusted diluted EPS | $0.55 | $0.39 to $0.74 | $0.31 to $0.87 |
All 19 quarters of eps model history
| Quarter ended | GAAP diluted EPS | Adjusted diluted EPS |
|---|---|---|
| 2026-07-31 | $0.09 | $0.40 |
| 2026-04-30 | $0.08 | $0.37 |
| 2026-01-31 | $0.47 | $0.49 |
| 2025-10-31 | $0.05 | $0.31 |
| 2025-07-31 | $0.05 | $0.33 |
| 2025-04-30 | $0.02 | $0.30 |
| 2025-01-31 | $1.12 | $0.42 |
| 2024-10-31 | $0.05 | $0.45 |
| 2024-07-31 | $0.10 | $0.44 |
| 2024-04-30 | $0.08 | $0.39 |
| 2024-01-31 | $0.57 | $0.42 |
| 2023-10-31 | $0.04 | $0.36 |
| 2023-07-31 | $0.04 | $0.36 |
| 2023-04-30 | $0.02 | $0.32 |
| 2023-01-31 | $0.10 | $0.37 |
| 2022-10-31 | $0.03 | $0.31 |
| 2022-07-31 | −$0.02 | $0.28 |
| 2022-04-30 | −$0.06 | $0.23 |
| 2022-01-31 | −$0.06 | $0.24 |
Analysts, realized surprises and market context
Last closing share price: $41.95 on 2026-11-06. Historical market prices.
No verified current event-window options quote is available. Market-implied EPS is not identifiable from the share price or an options move alone. No directional market EPS forecast is presented. An earnings beat can accompany a falling share price when guidance, valuation or other news dominates.
| Quarter / release date | Model median | Model 80% range | Analyst consensus | Reported EPS | Actual − consensus | Next-session stock return |
|---|---|---|---|---|---|---|
| 2026-07-31 2026-08-25 | $0.431 | $0.35 to $0.51 | $0.3981 | $0.40 | $+0.0019 | +1.18% |
| 2026-04-30 2026-05-26 | $0.403 | $0.32 to $0.50 | $0.3600 | $0.37 | $+0.0100 | -3.71% |
| 2026-01-31 2026-03-03 | $0.363 | $0.28 to $0.44 | $0.3300 | $0.49 | $+0.1600 | +10.16% |
| 2025-07-31 2025-08-26 | $0.335 | $0.27 to $0.41 | $0.3100 | $0.33 | $+0.0200 | +4.17% |
| 2025-04-30 2025-05-27 | $0.415 | $0.36 to $0.47 | $0.2500 | $0.30 | $+0.0500 | +17.23% |
Does the linked model improve predictions?
Adjusted EPS: model MAE $0.068, last-quarter baseline MAE $0.076; the nominal 80% range covered 3/7 outcomes. These are reconstructed checks, not archived live forecasts. Compare mean absolute error (MAE) with carrying forward the last reported value and with the same quarter a year earlier. Lower is better. The model is not consistently superior across measures and horizons.
| Measure | Model MAE | Last-quarter MAE | Year-earlier MAE | 80% covered | 95% covered |
|---|---|---|---|---|---|
| Revenue | $4.5M | $7.4M | $22.9M | 6/7 | 7/7 |
| GAAP operating costs | $4.6M | $5.5M | $18.2M | 7/7 | 7/7 |
| Adjusted operating costs | $4.3M | $5.2M | $14.1M | 5/7 | 7/7 |
| GAAP common earnings | $33.6M | $64.3M | $30.3M | 5/7 | 5/7 |
| Adjusted common earnings | $10.1M | $11.3M | $10.2M | 3/7 | 6/7 |
| Basic shares | 1.2M | 1.3M | 2.4M | 6/7 | 6/7 |
| GAAP diluted shares | 3.0M | 2.2M | 5.0M | 3/7 | 6/7 |
| GAAP diluted EPS | $0.226 | $0.431 | $0.201 | 5/7 | 5/7 |
| Adjusted diluted EPS | $0.068 | $0.076 | $0.079 | 3/7 | 6/7 |
Longer-horizon errors and coverage
| Measure | Quarters ahead | Cases | Model MAE | Last-quarter MAE | Year-earlier MAE | 80% covered | 95% covered |
|---|---|---|---|---|---|---|---|
| Revenue | 2 | 6 | $9.0M | $11.9M | $24.0M | 6/6 | 6/6 |
| Revenue | 3 | 5 | $9.7M | $20.3M | $26.5M | 5/5 | 5/5 |
| Revenue | 4 | 4 | $10.3M | $27.1M | $27.1M | 4/4 | 4/4 |
| GAAP operating costs | 2 | 6 | $6.2M | $8.8M | $17.9M | 6/6 | 6/6 |
| GAAP operating costs | 3 | 5 | $7.9M | $11.5M | $16.8M | 5/5 | 5/5 |
| GAAP operating costs | 4 | 4 | $9.2M | $15.1M | $15.1M | 4/4 | 4/4 |
| Adjusted operating costs | 2 | 6 | $6.2M | $8.2M | $14.8M | 6/6 | 6/6 |
| Adjusted operating costs | 3 | 5 | $4.3M | $10.9M | $15.3M | 5/5 | 5/5 |
| Adjusted operating costs | 4 | 4 | $4.8M | $14.9M | $14.9M | 4/4 | 4/4 |
| GAAP common earnings | 2 | 6 | $12.6M | $48.0M | $21.3M | 5/6 | 5/6 |
| GAAP common earnings | 3 | 5 | $19.1M | $47.3M | $24.0M | 4/5 | 4/5 |
| GAAP common earnings | 4 | 4 | $23.4M | $28.4M | $28.4M | 3/4 | 4/4 |
| Adjusted common earnings | 2 | 6 | $12.4M | $13.5M | $11.4M | 4/6 | 5/6 |
| Adjusted common earnings | 3 | 5 | $18.5M | $14.2M | $11.1M | 3/5 | 4/5 |
| Adjusted common earnings | 4 | 4 | $15.4M | $10.1M | $10.1M | 3/4 | 3/4 |
| Basic shares | 2 | 6 | 2.5M | 2.4M | 2.7M | 4/6 | 4/6 |
| Basic shares | 3 | 5 | 3.4M | 3.2M | 3.1M | 3/5 | 3/5 |
| Basic shares | 4 | 4 | 3.9M | 3.7M | 3.7M | 2/4 | 3/4 |
| GAAP diluted shares | 2 | 6 | 4.4M | 3.7M | 5.1M | 3/6 | 4/6 |
| GAAP diluted shares | 3 | 5 | 5.3M | 5.4M | 6.0M | 2/5 | 3/5 |
| GAAP diluted shares | 4 | 4 | 5.6M | 6.3M | 6.3M | 2/4 | 3/4 |
| GAAP diluted EPS | 2 | 6 | $0.088 | $0.327 | $0.143 | 4/6 | 5/6 |
| GAAP diluted EPS | 3 | 5 | $0.130 | $0.318 | $0.160 | 4/5 | 4/5 |
| GAAP diluted EPS | 4 | 4 | $0.158 | $0.188 | $0.188 | 3/4 | 4/4 |
| Adjusted diluted EPS | 2 | 6 | $0.087 | $0.093 | $0.092 | 4/6 | 5/6 |
| Adjusted diluted EPS | 3 | 5 | $0.118 | $0.110 | $0.092 | 3/5 | 4/5 |
| Adjusted diluted EPS | 4 | 4 | $0.102 | $0.088 | $0.088 | 3/4 | 3/4 |
Model and source notes
Reported revenue history
Consolidated revenue in USD, using the latest available SEC filing values. Fourth quarters are derived from annual totals less the first nine months where necessary. Historical revisions are retained; the backtests are not real-time archived forecasts.
View all 50 quarters
| Quarter ended | Revenue |
|---|---|
| 2014-04-30 | $45.3M |
| 2014-07-31 | $51.4M |
| 2014-10-31 | $57.0M |
| 2015-01-31 | $62.6M |
| 2015-04-30 | $65.6M |
| 2015-07-31 | $73.5M |
| 2015-10-31 | $78.7M |
| 2016-01-31 | $85.0M |
| 2016-04-30 | $90.2M |
| 2016-07-31 | $95.7M |
| 2016-10-31 | $102.8M |
| 2017-01-31 | $109.9M |
| 2017-04-30 | $117.2M |
| 2017-07-31 | $122.9M |
| 2017-10-31 | $129.3M |
| 2018-01-31 | $136.7M |
| 2018-04-30 | $140.5M |
| 2018-07-31 | $148.2M |
| 2018-10-31 | $155.9M |
| 2019-01-31 | $163.7M |
| 2019-04-30 | $163.0M |
| 2019-07-31 | $172.5M |
| 2019-10-31 | $177.2M |
| 2020-01-31 | $183.6M |
| 2020-04-30 | $183.6M |
| 2020-07-31 | $192.3M |
| 2020-10-31 | $196.0M |
| 2021-01-31 | $198.9M |
| 2021-04-30 | $202.4M |
| 2021-07-31 | $214.5M |
| 2021-10-31 | $224.0M |
| 2022-01-31 | $233.4M |
| 2022-04-30 | $238.4M |
| 2022-07-31 | $246.0M |
| 2022-10-31 | $250.0M |
| 2023-01-31 | $256.5M |
| 2023-04-30 | $251.9M |
| 2023-07-31 | $261.4M |
| 2023-10-31 | $261.5M |
| 2024-01-31 | $262.9M |
| 2024-04-30 | $264.7M |
| 2024-07-31 | $270.0M |
| 2024-10-31 | $275.9M |
| 2025-01-31 | $279.5M |
| 2025-04-30 | $276.3M |
| 2025-07-31 | $294.0M |
| 2025-10-31 | $301.1M |
| 2026-01-31 | $305.9M |
| 2026-04-30 | $305.9M |
| 2026-07-31 | $321.1M |