Berkshire Hathaway Inc BRK.B
Revenue Intelligence Report • 69 quarters of SEC filing data • Updated 2026-03-15
Revenue is expected to grow modestly, about 2.6% year over year, placing FY revenue near $391 billion as Berkshire leverages its diversified earnings mix. Our econometric model shows the trajectory is driven by a steady, evolving spend pattern, with SG&A elasticity rising from about 0.62x to 0.74x over the sample period and now near 0.97x, implying spending is increasingly linked to topline outcomes. The forecast framework uses a log-log specification with time-varying coefficients to reflect these shifts; in a holdout, the model forecasted 97.1B versus 94.2B actual, a roughly 3% miss, with a MAPE around 2.7%. Key risk remains macro and investment-cycle sensitivity: weaker markets or underwriting losses could meaningfully constrain the growth path.
Investment Thesis
Our ARDL model tracks Berkshire Hathaway Inc's revenue with exceptional precision (2.7% MAPE), indicating highly predictable cash flows. Sales & marketing spend shows a 0.97x elasticity, suggesting effective go-to-market execution.
Revenue Forecast
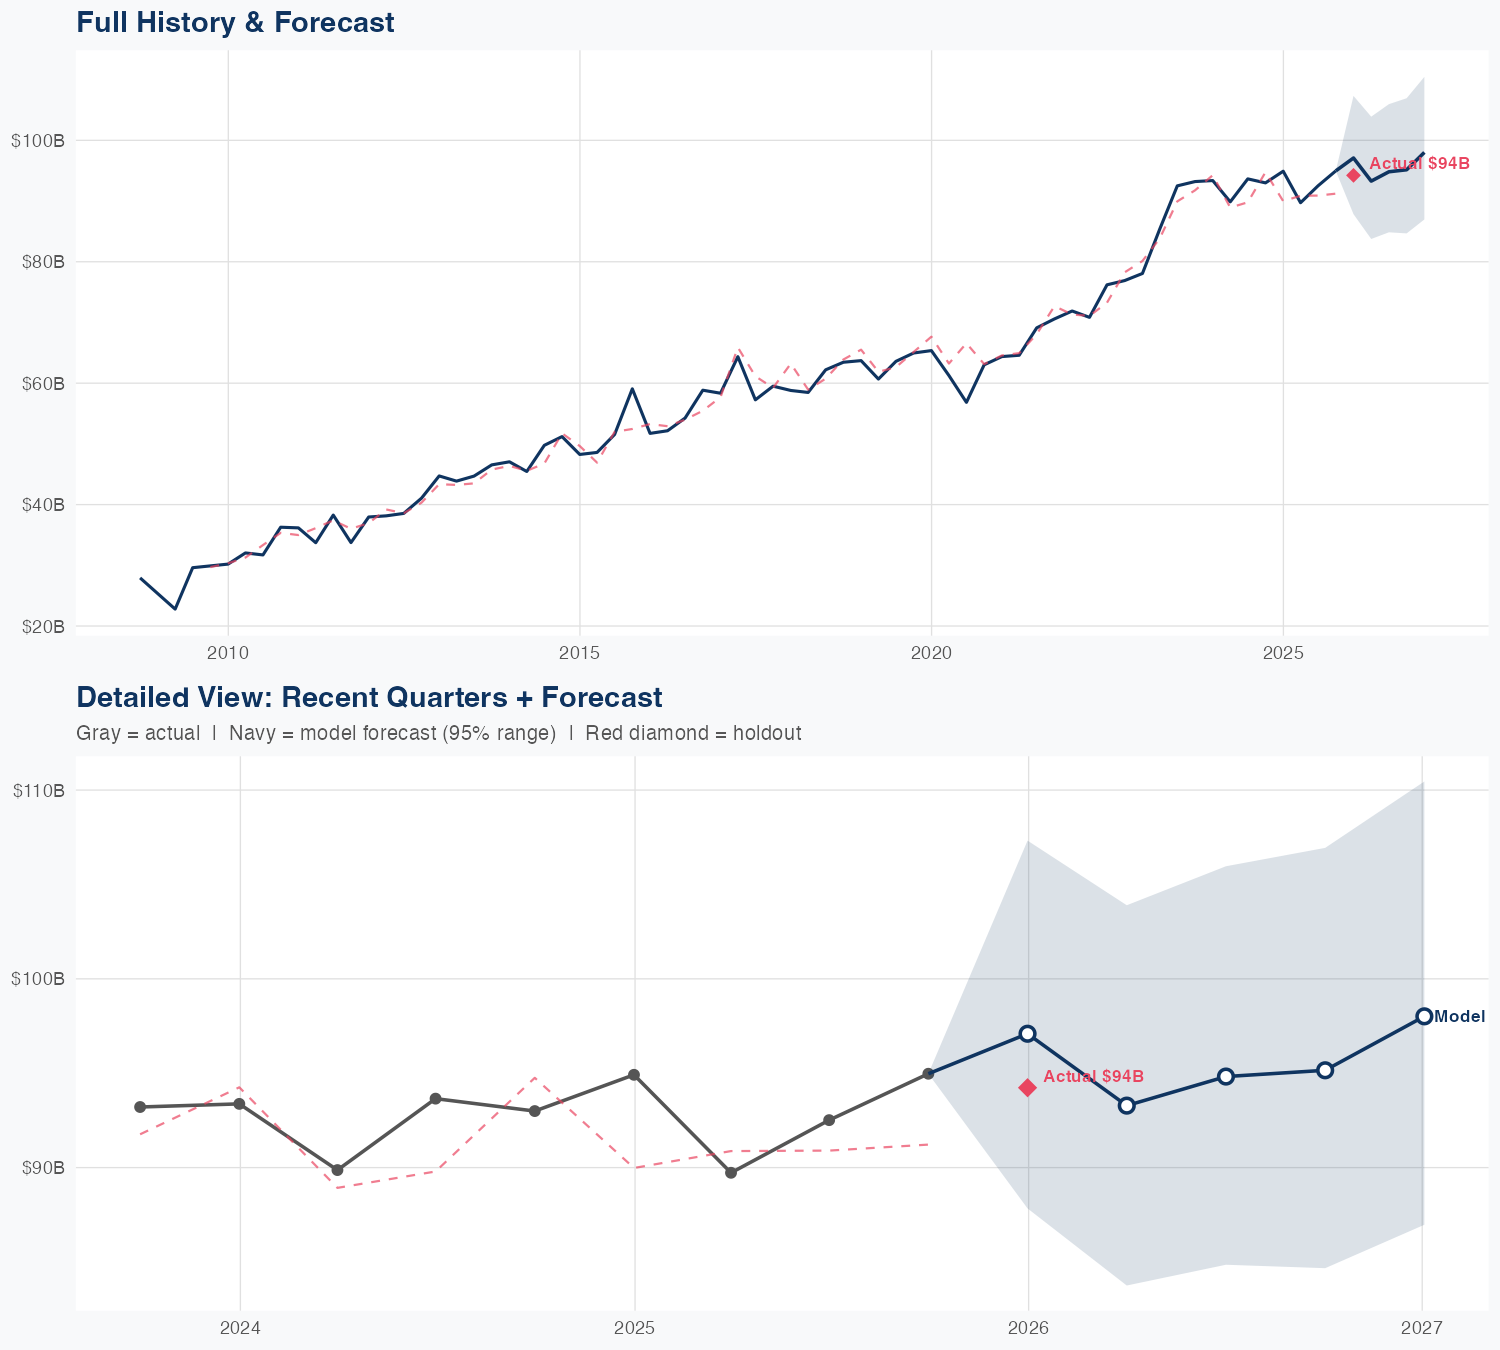
Quarterly Detail
| Quarter | Model Forecast | Actual | 95% Range | YoY Growth | Status |
|---|---|---|---|---|---|
| Q4 2025 | $97B | $94B | $88B – $107B | +2.3% | ✓ In range |
| Q2 2026 | $93B | $84B – $104B | +4.0% | ||
| Q3 2026 | $95B | $85B – $106B | +2.5% | ||
| Q4 2026 | $95B | $85B – $107B | +0.2% | ||
| Q1 2027 | $98B | $87B – $110B | +4.0% |
How Spending Drives Revenue
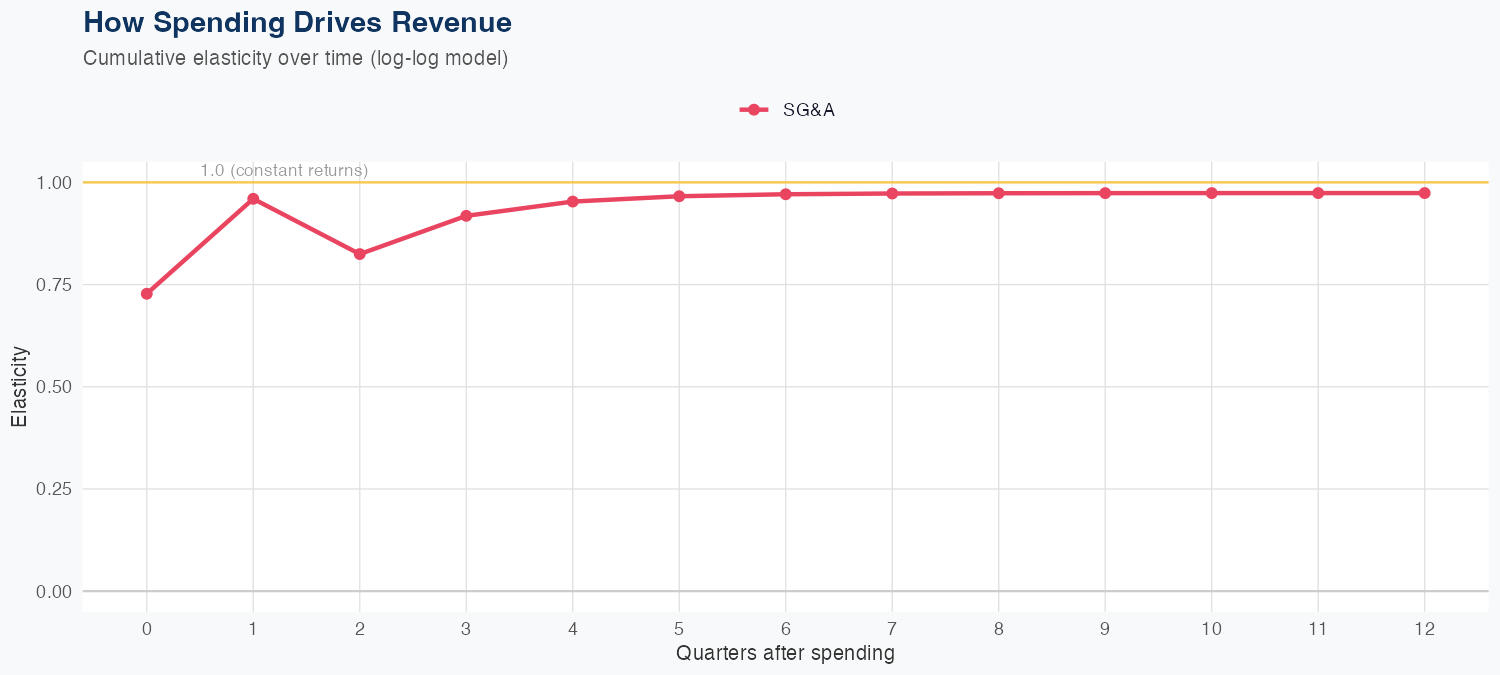
Spending Efficiency Over Time
Current SG&A elasticity: 0.7425x
Want this analysis for your portfolio?
I build custom revenue intelligence reports for investors and companies using SEC filing data, econometric modeling, and AI-powered insights.
Get in Touch