Brown & Brown, Inc. BRO
Revenue Intelligence Report • 61 quarters of SEC filing data • Updated 2026-03-15
Revenue is forecast to grow about 11% year over year to roughly $5.8 billion, with momentum underpinned by structural/platform growth and higher SG&A investment. Our econometric model indicates the binding constraint on growth is the capacity to deploy SG&A spending—specifically recruiting and onboarding more agents/brokers to expand the network—as SG&A elasticity remains high and rising (roughly 0.81x now and moving toward 0.91x). Forecast attribution shows structural/platform growth contributing about 8% and SG&A driving about 92% of the incremental revenue, with R&D essentially flat. Key risk: a slowdown in expanding the agent network or constraints on onboarding capacity could cap upside even as economics remain favorable.
Investment Thesis
Our ARDL model tracks Brown & Brown, Inc.'s revenue with exceptional precision (2.5% MAPE), indicating highly predictable cash flows. Sales & marketing spend shows a 0.81x elasticity, suggesting effective go-to-market execution.
Revenue Forecast
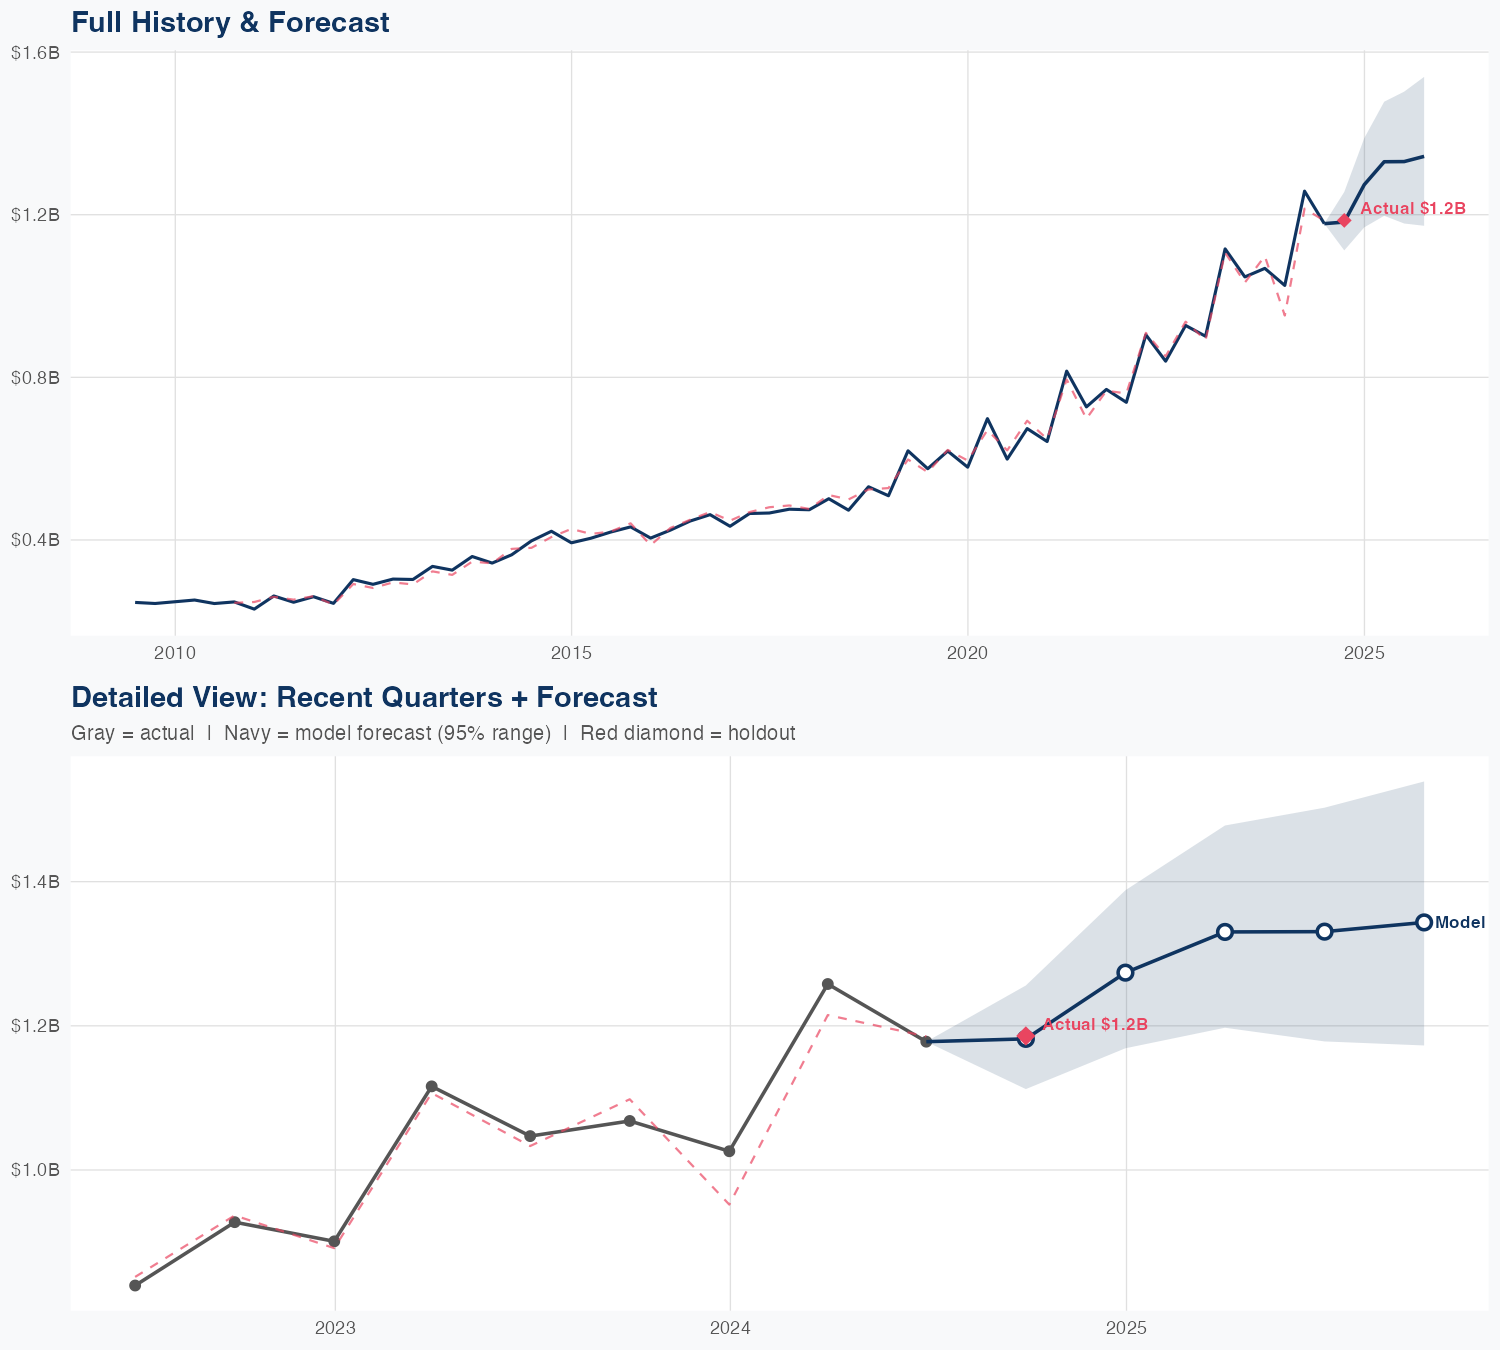
Quarterly Detail
| Quarter | Model Forecast | Actual | 95% Range | YoY Growth | Status |
|---|---|---|---|---|---|
| Q3 2024 | $1.2B | $1.2B | $1.1B – $1.3B | +12.5% | ✓ In range |
| Q4 2024 | $1.1B | $1.0B – $1.2B | +10.6% | ||
| Q2 2025 | $1.4B | $1.2B – $1.5B | +7.4% | ||
| Q3 2025 | $1.3B | $1.2B – $1.5B | +13.3% | ||
| Q4 2025 | $1.3B | $1.2B – $1.5B | +12.3% |
Seasonal Factors
| Fiscal Quarter | Seasonal Factor | vs Trend | Interpretation | Obs. |
|---|---|---|---|---|
| FQ1 (Sep–Nov) | 0.9951 | -0.5% | In line with trend | 15 |
| FQ2 (Dec–Feb) | 0.9956 | -0.4% | In line with trend | 14 |
| FQ3 (Mar–May) | 1.0084 | +0.8% | In line with trend | 14 |
| FQ4 (Jun–Aug) | 0.997 | -0.3% | In line with trend | 14 |
How Spending Drives Revenue
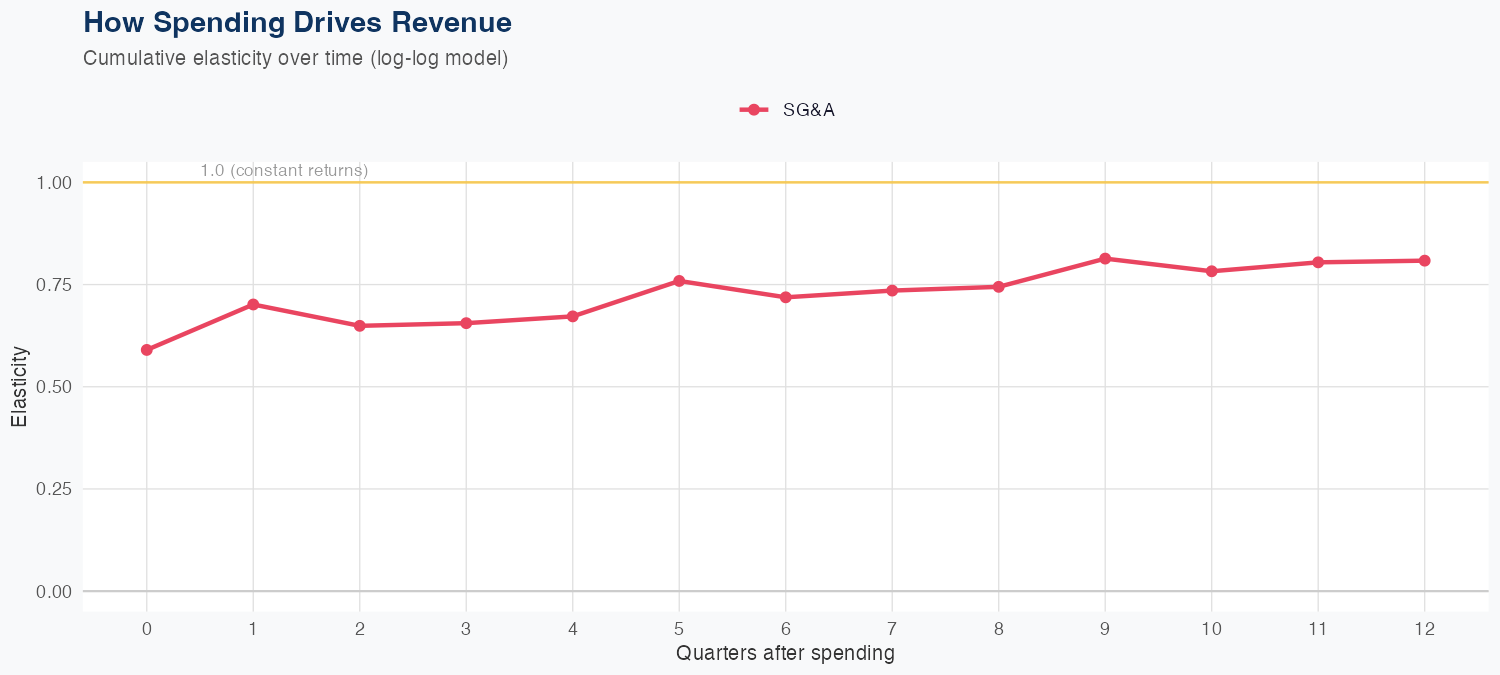
Spending Efficiency Over Time
Current SG&A elasticity: 0.9077x
Want this analysis for your portfolio?
I build custom revenue intelligence reports for investors and companies using SEC filing data, econometric modeling, and AI-powered insights.
Get in Touch