Burlington Stores, Inc. BURL
Revenue Intelligence Report • 52 quarters of SEC filing data • Updated 2026-03-15
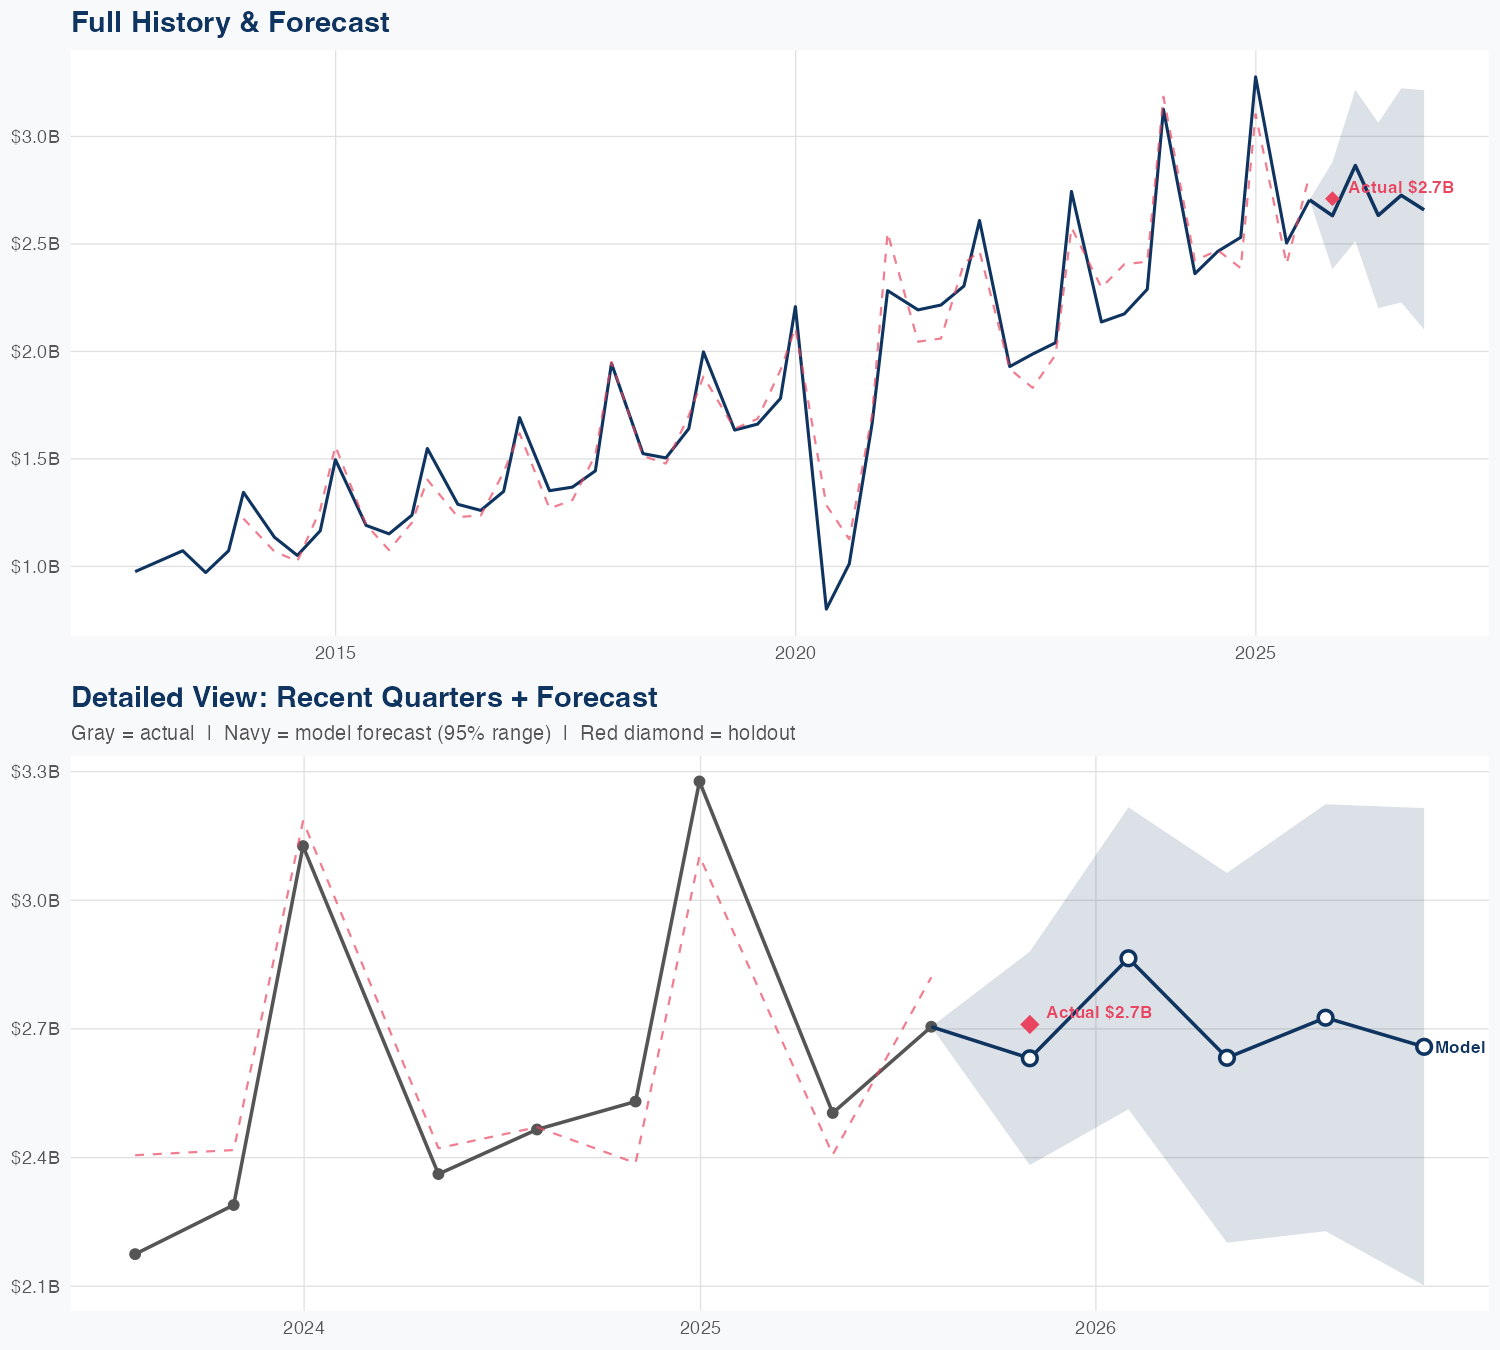
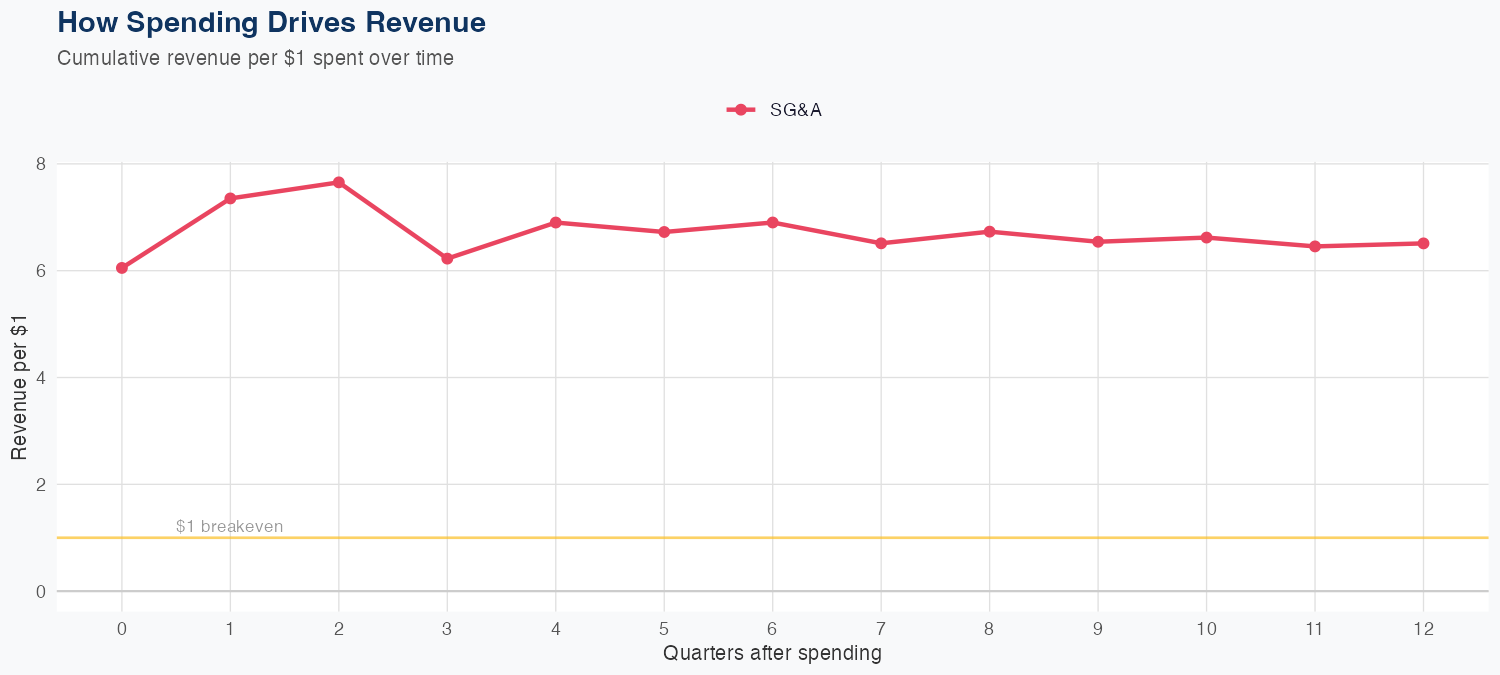
Revenue is driven primarily by SG&A spending efficiency, with each $1 of SG&A generating about $6.51 in long-run revenue, and no R&D input factored into the driver set. The latest quarterly revenue is $2,710 million, supported by 52 quarters of data underpinning the linear model. Holdout testing produced a predicted $2.6B versus actual $2.7B (2.9% error), with an overall model accuracy of 5.9% MAPE. The FY forecast calls for about $11B in revenue, a decline of 2.8% year over year, suggesting a modest near-term headwind despite the favorable SG&A ROI.
Investment Thesis
The econometric model achieves strong accuracy (5.9% MAPE), suggesting Burlington Stores, Inc.'s revenue trajectory is well-characterized by its spending patterns. Each $1 of SG&A spending generates $6.51 in revenue, reflecting strong commercial efficiency.
Revenue Forecast
Quarterly Detail
| Quarter | Model Forecast | Actual | 95% Range | YoY Growth | Status |
|---|---|---|---|---|---|
| Q4 2025 | $2.6B | $2.7B | $2.4B – $2.9B | +4.0% | ✓ In range |
| Q1 2026 | $2.9B | $2.5B – $3.2B | -12.6% | ||
| Q2 2026 | $2.6B | $2.2B – $3.1B | +5.1% | ||
| Q3 2026 | $2.7B | $2.2B – $3.2B | +0.8% | ||
| Q4 2026 | $2.7B | $2.1B – $3.2B | -1.9% |
Seasonal Factors
| Fiscal Quarter | Seasonal Factor | vs Trend | Interpretation | Obs. |
|---|---|---|---|---|
| FQ1 (Sep–Nov) | 0.9643 | -3.6% | -3.6% below trend | 12 |
| FQ2 (Dec–Feb) | 1.056 | +5.6% | +5.6% above trend | 12 |
| FQ3 (Mar–May) | 1.0073 | +0.7% | In line with trend | 12 |
| FQ4 (Jun–Aug) | 1.0194 | +1.9% | In line with trend | 12 |
How Spending Drives Revenue
Want this analysis for your portfolio?
I build custom revenue intelligence reports for investors and companies using SEC filing data, econometric modeling, and AI-powered insights.
Get in Touch