Citigroup inc C
Revenue Intelligence Report • 48 quarters of SEC filing data • Updated 2026-03-15
FY revenue stands at about 83.3 billion and is forecast to decline roughly 2% year over year, with cyclical headwinds weighing on activity but structural/platform growth providing a modest offset. Based on our econometric model, the binding constraint on revenue growth is capital deployment capacity under regulatory capital requirements; platform scale and pricing power act as the growth engine, while SG&A spending appears more maintenance-like. R&D is not a driver, and the time-varying view shows SG&A margins turning more negative, underscoring that platform scale and recurring revenue are the primary accelerants rather than incremental spend. Key risk: a sharper macro slowdown or tighter regulatory capital rules could further constrain Citi’s capacity to grow revenue through balance-sheet expansion.
Investment Thesis
The econometric model achieves strong accuracy (3.7% MAPE), suggesting Citigroup inc's revenue trajectory is well-characterized by its spending patterns. Each $1 of SG&A spending generates $0.73 in revenue, reflecting strong commercial efficiency.
Revenue Forecast
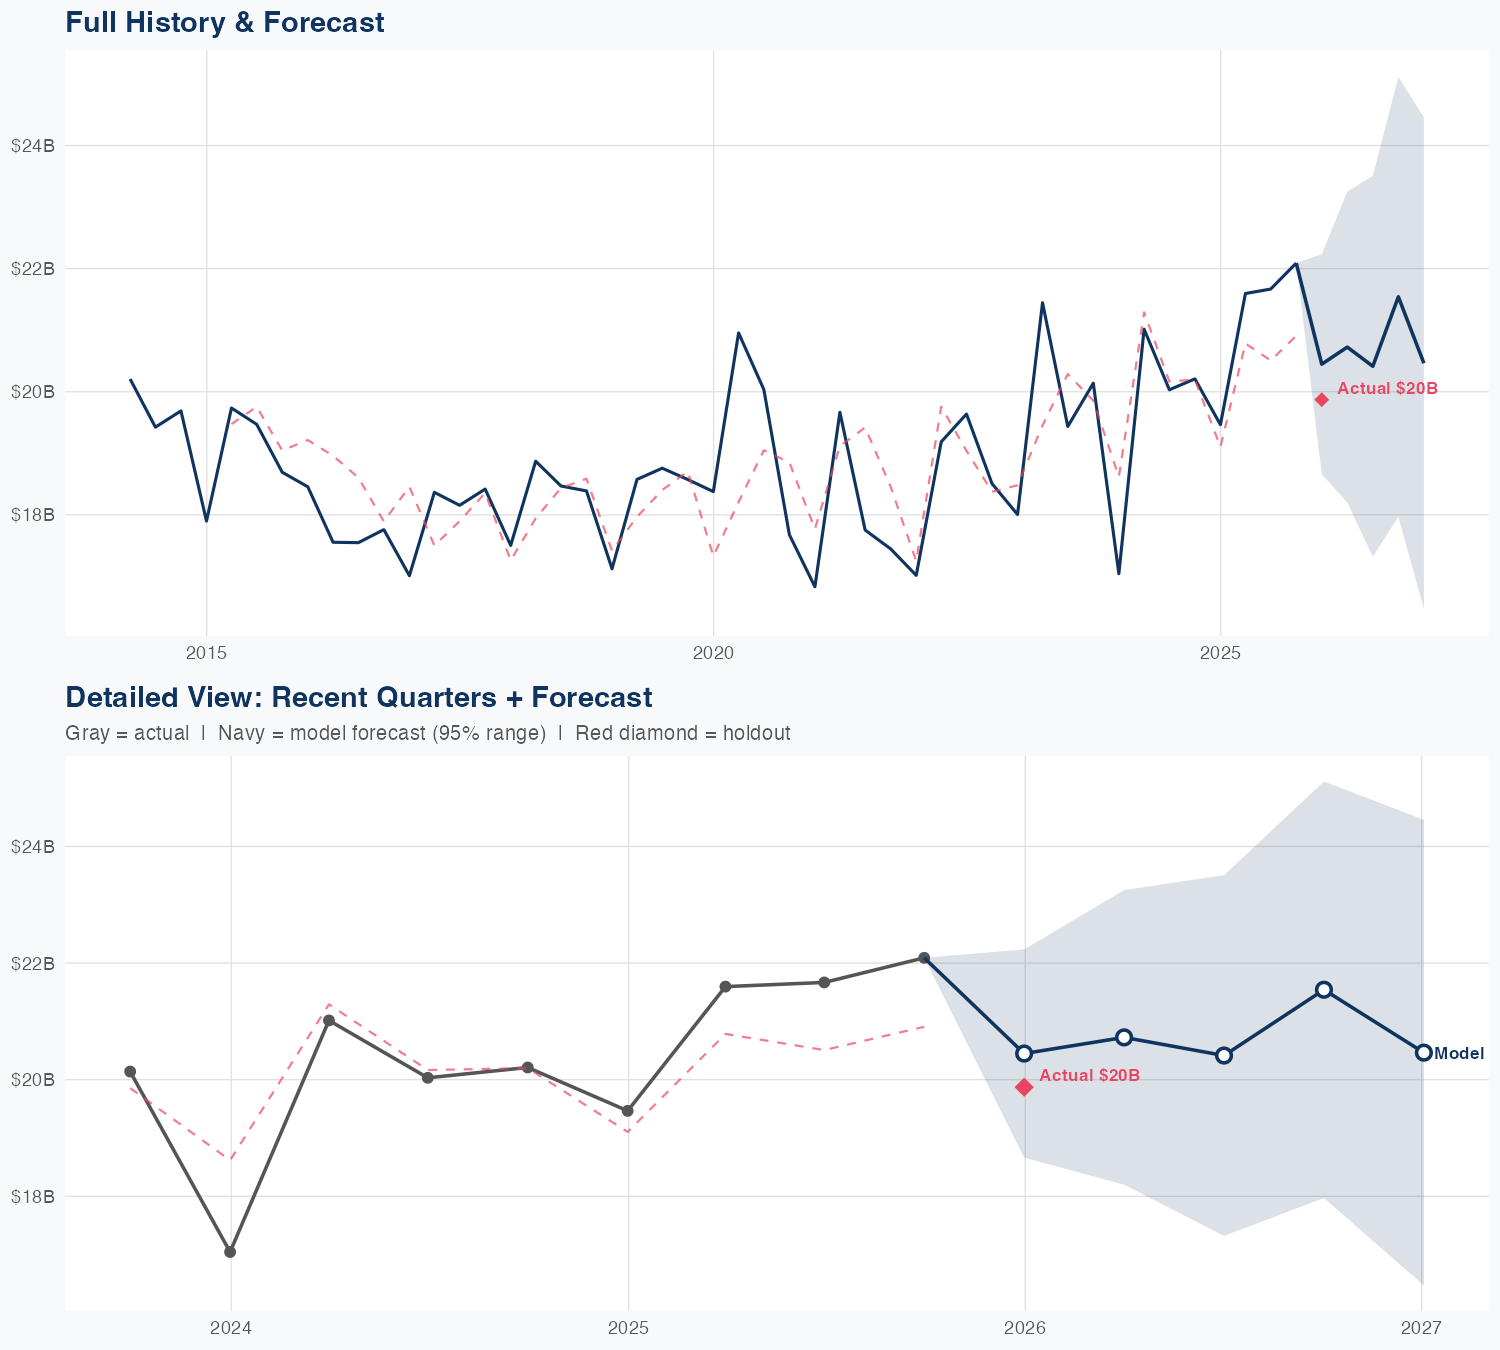
Quarterly Detail
| Quarter | Model Forecast | Actual | 95% Range | YoY Growth | Status |
|---|---|---|---|---|---|
| Q4 2025 | $20B | $20B | $19B – $22B | +5.3% | ✓ In range |
| Q2 2026 | $20B | $18B – $23B | -5.1% | ||
| Q3 2026 | $20B | $17B – $23B | -6.1% | ||
| Q4 2026 | $22B | $18B – $25B | -1.8% | ||
| Q1 2027 | $21B | $17B – $25B | +4.6% |
Seasonal Factors
| Fiscal Quarter | Seasonal Factor | vs Trend | Interpretation | Obs. |
|---|---|---|---|---|
| FQ1 (Sep–Nov) | 0.993 | -0.7% | In line with trend | 11 |
| FQ2 (Dec–Feb) | 0.9745 | -2.5% | In line with trend | 11 |
| FQ3 (Mar–May) | 1.0338 | +3.4% | +3.4% above trend | 11 |
| FQ4 (Jun–Aug) | 1.0018 | +0.2% | In line with trend | 11 |
How Spending Drives Revenue
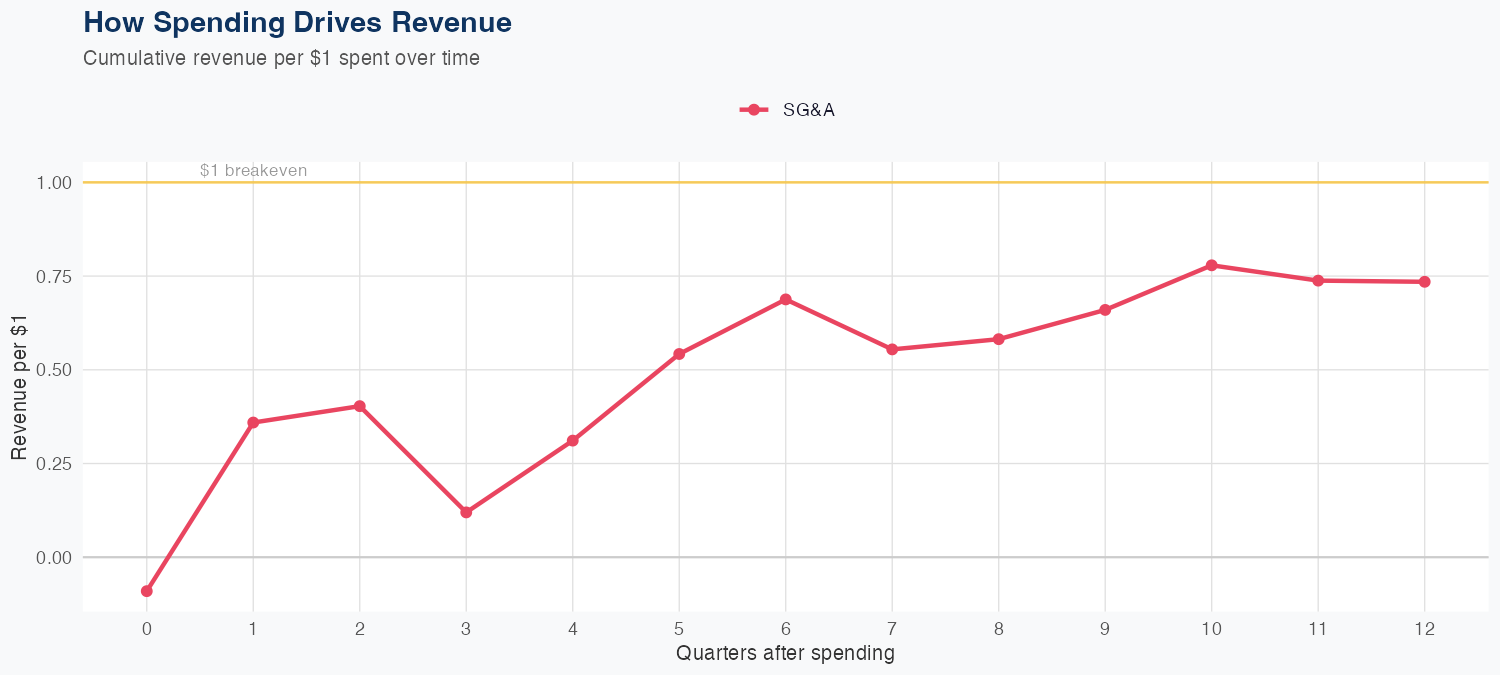
Spending Efficiency Over Time
Current SG&A multiplier: -0.4824
Want this analysis for your portfolio?
I build custom revenue intelligence reports for investors and companies using SEC filing data, econometric modeling, and AI-powered insights.
Get in Touch