Cbre Group, Inc. CBRE
Revenue Intelligence Report • 8 quarters of SEC filing data • Updated 2026-03-15
CBRE’s FY revenue is projected to grow about 2% year over year to roughly $22.9 billion, supported by a mix of structural/platform growth and disciplined SG&A investment. In our econometric model, growth is split roughly one-third from structural/platform expansion and two-thirds from SG&A investment, with SG&A elasticity rising and making spending a meaningful growth lever. Binding constraint: delivery capacity—staffing and utilization limits in advisory and brokerage services—appears to cap upside even as SG&A investment drives topline gains. The time-varying coefficients suggest incremental SG&A spend is increasingly productive, but only if the firm can deploy additional billable headcount to absorb the activity. Key risk: a sharper slowdown in global CRE demand or deal flow could curb utilization and blunt the potential upside from SG&A-driven growth.
Investment Thesis
Our ARDL model tracks Cbre Group, Inc.'s revenue with exceptional precision (2.3% MAPE), indicating highly predictable cash flows. Sales & marketing spend shows a 1.02x elasticity, suggesting effective go-to-market execution.
Revenue Forecast
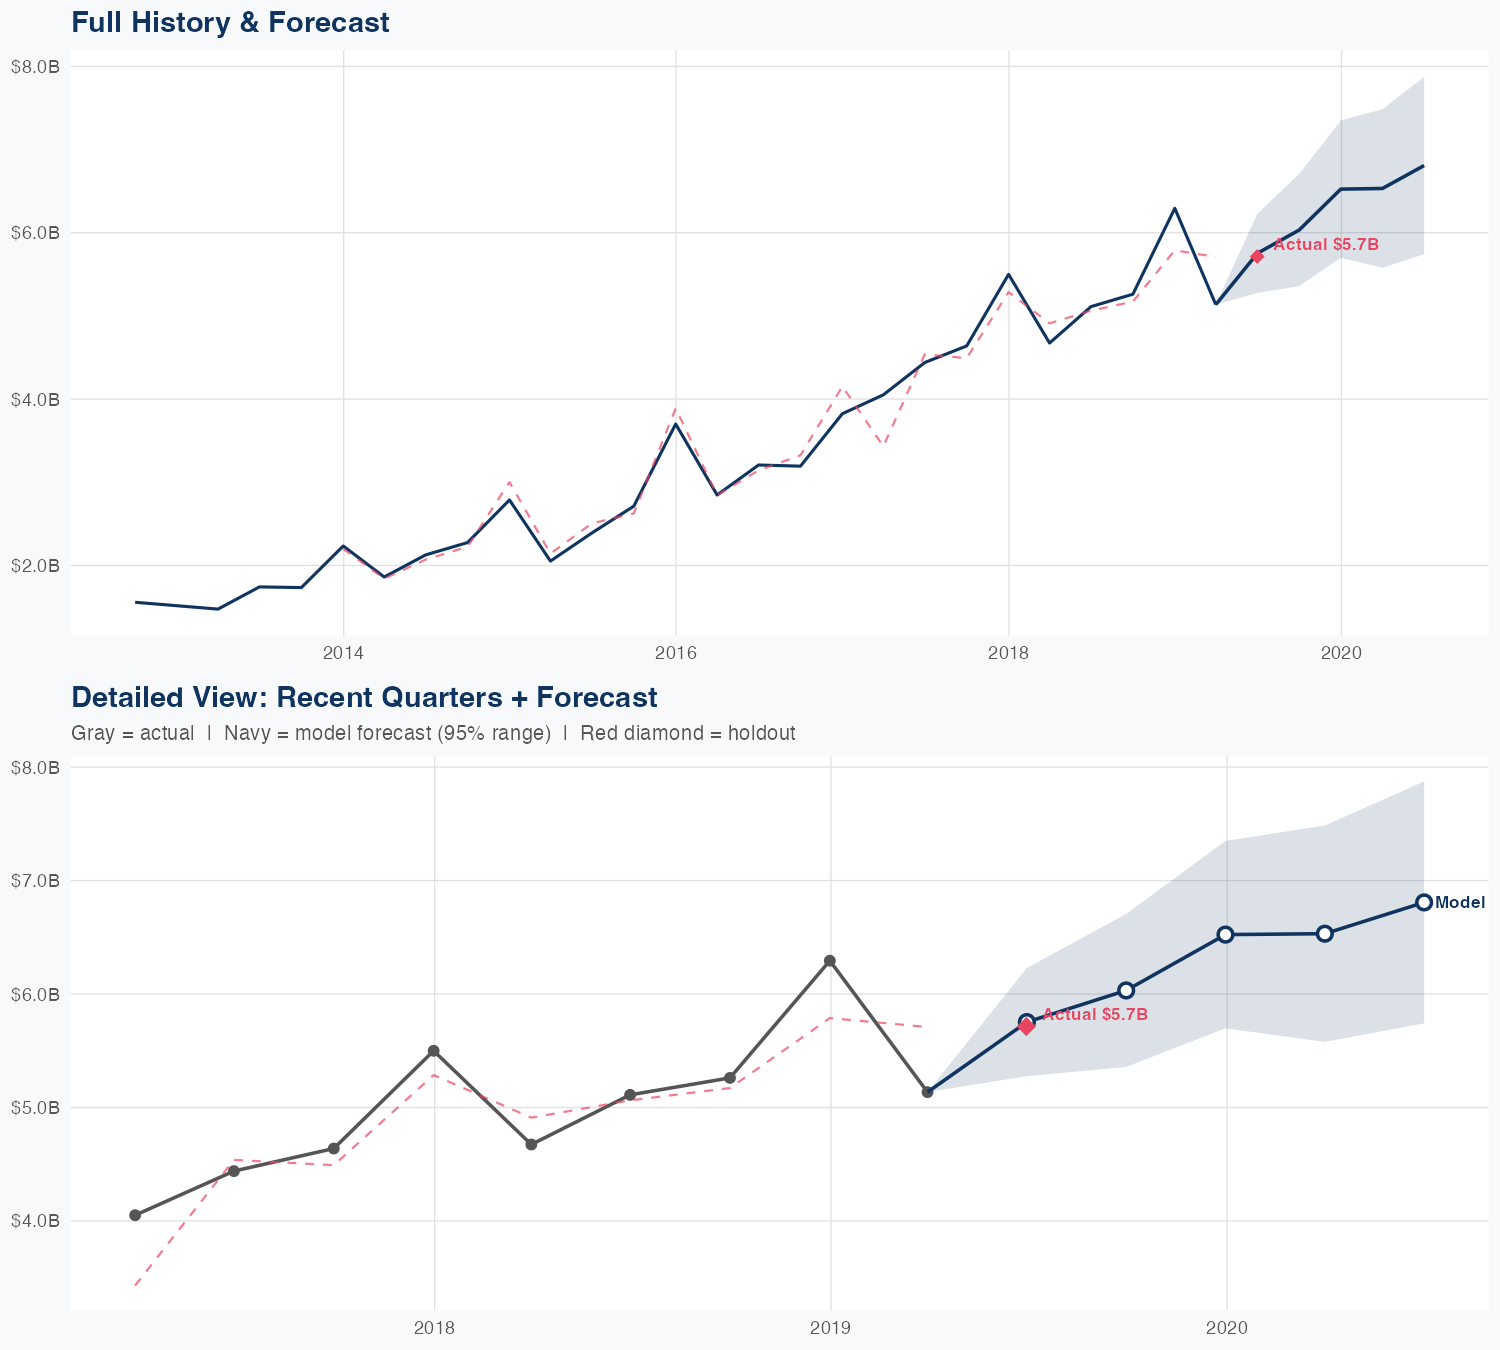
Quarterly Detail
| Quarter | Model Forecast | Actual | 95% Range | YoY Growth | Status |
|---|---|---|---|---|---|
| Q3 2019 | $5.8B | $5.7B | $5.4B – $6.2B | +13.6% | ✓ In range |
| Q4 2019 | $5.6B | $5.1B – $6.1B | +6.7% | ||
| Q1 2020 | $6.8B | $5.9B – $7.8B | +7.4% | ||
| Q2 2020 | $4.7B | $3.8B – $5.8B | -8.4% | ||
| Q3 2020 | $5.8B | $4.8B – $7.1B | +2.3% |
How Spending Drives Revenue
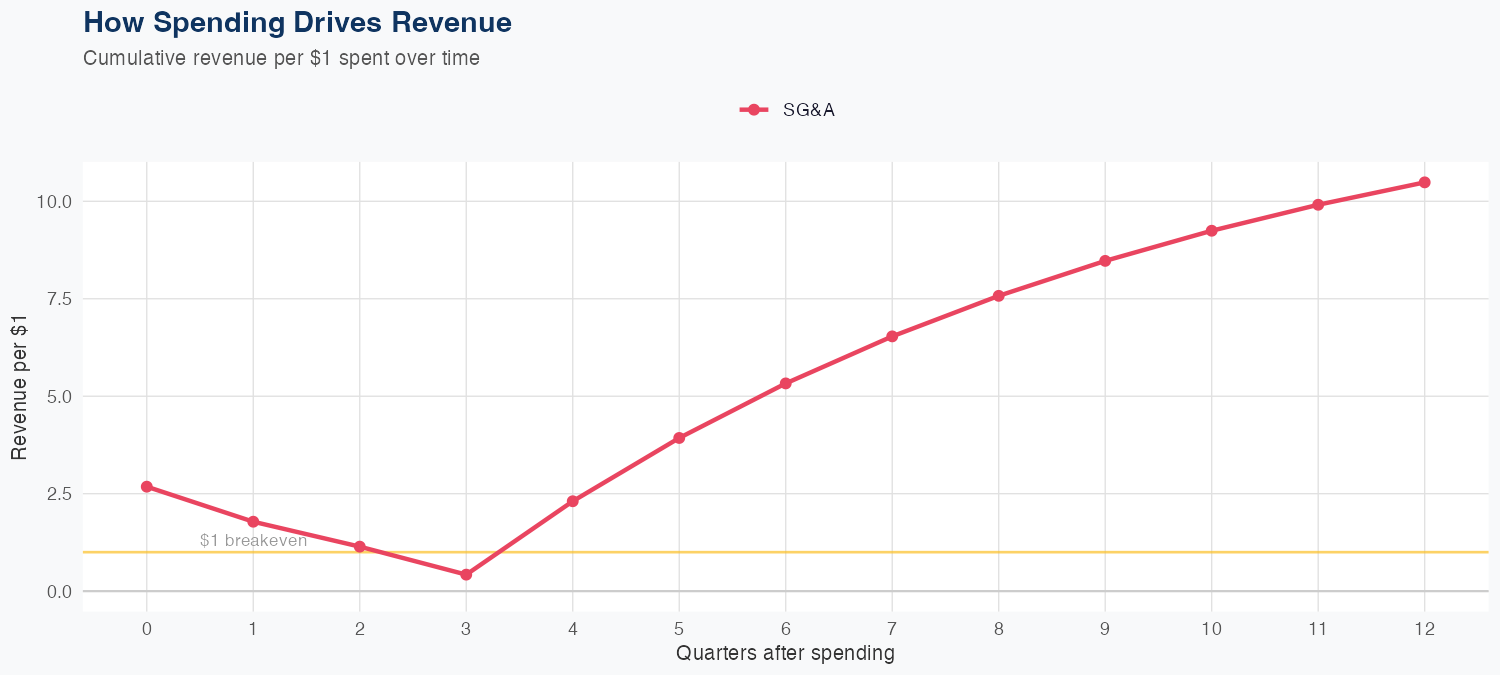
Spending Efficiency Over Time
Current SG&A elasticity: 1.4869x
Want this analysis for your portfolio?
I build custom revenue intelligence reports for investors and companies using SEC filing data, econometric modeling, and AI-powered insights.
Get in Touch