Constellation Energy Corporation CEG
Revenue Intelligence Report • 20 quarters of SEC filing data • Updated 2026-03-15
Revenue is projected to grow modestly this year, up about 1.5% year over year to roughly $26.0 billion, with the uplift concentrated in structural/platform expansion rather than a broad volume pickup. Our econometric model shows the growth lever is SG&A investment, with the SG&A multiplier rising from the mid-0.5s to about 0.66, implying incremental SG&A spend is translating into outsized topline gains. Binding constraint: spending capacity to fund and deploy higher SG&A investment. In this framework, the primary growth engine is SG&A, while R&D remains negligible. Key risk: if the company cannot scale SG&A investment or if demand weakens, the forecast could underperform.
Investment Thesis
The econometric model achieves strong accuracy (3.1% MAPE), suggesting Constellation Energy Corporation's revenue trajectory is well-characterized by its spending patterns. Each $1 of SG&A spending generates $0.55 in revenue, reflecting strong commercial efficiency.
Revenue Forecast
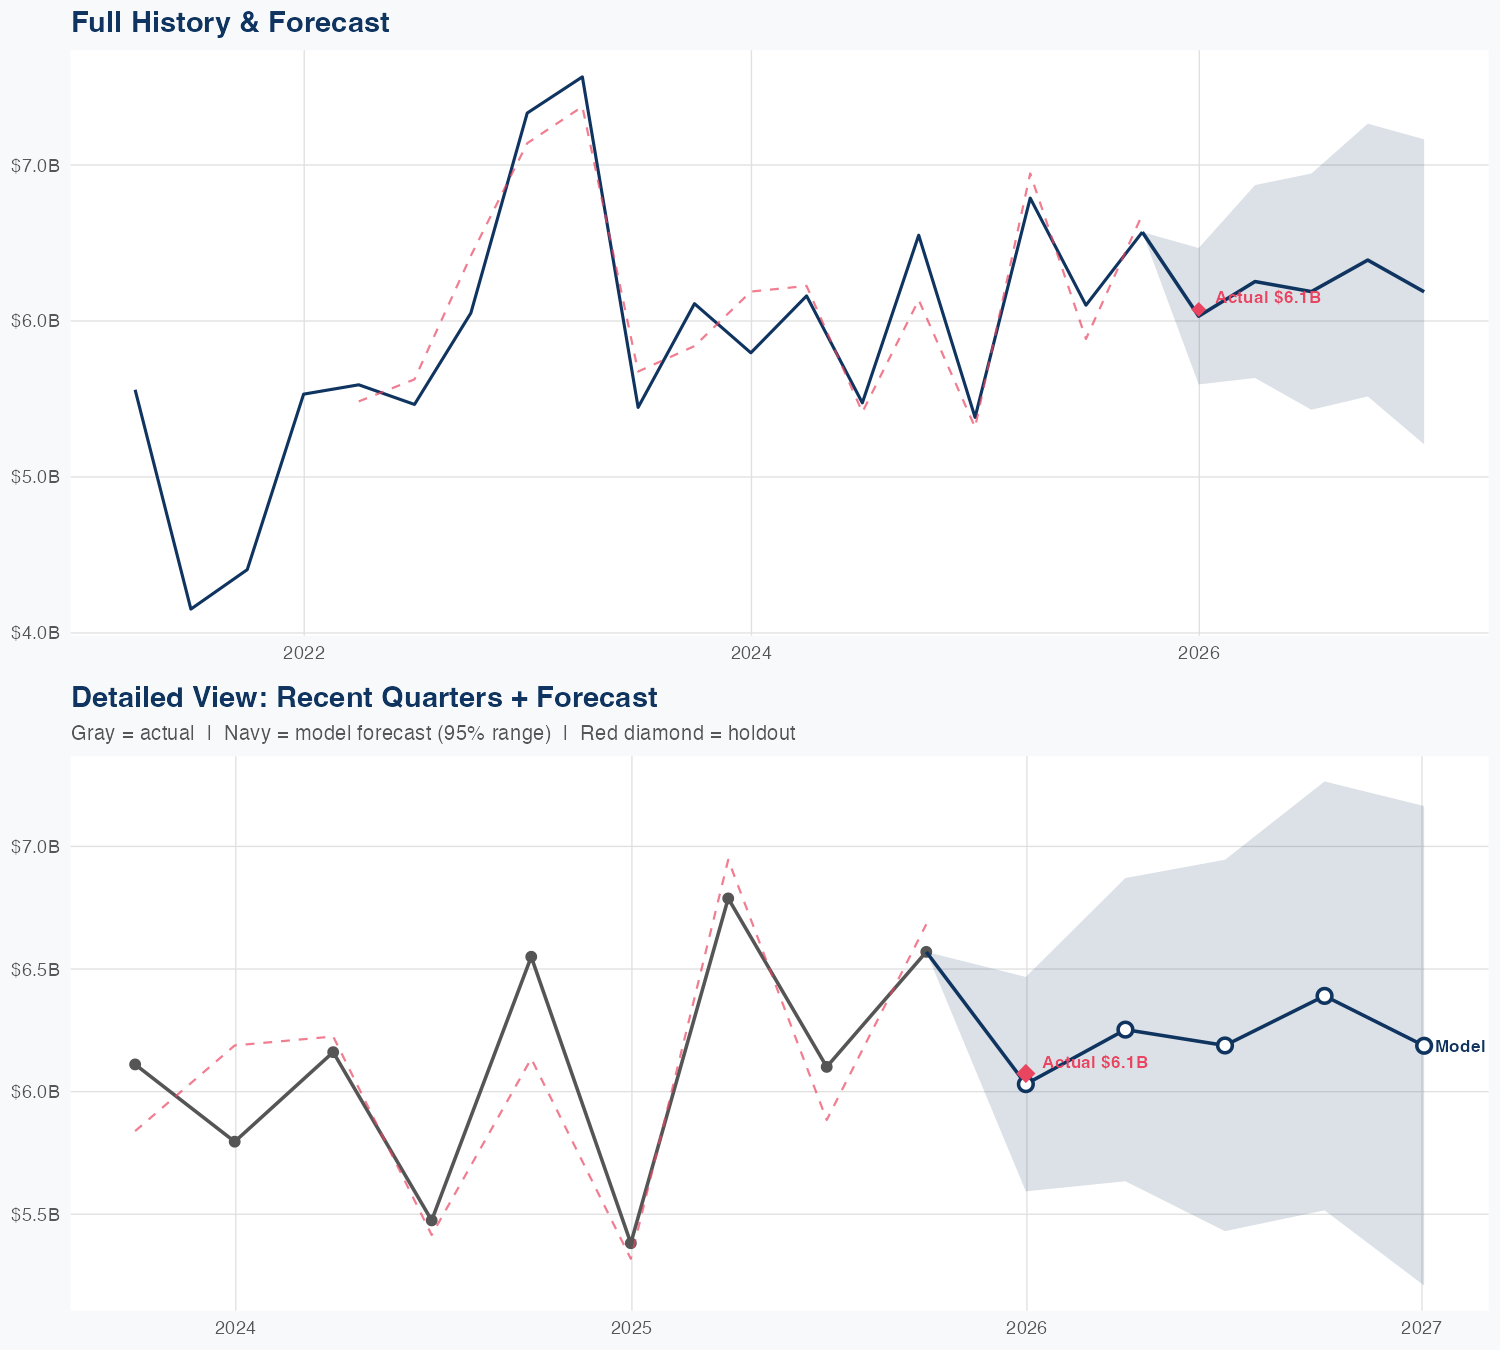
Quarterly Detail
| Quarter | Model Forecast | Actual | 95% Range | YoY Growth | Status |
|---|---|---|---|---|---|
| Q4 2025 | $6.3B | $6.1B | $5.5B – $7.1B | +16.9% | ✓ In range |
| Q2 2026 | $7.1B | $6.0B – $8.3B | +4.2% | ||
| Q3 2026 | $6.1B | $5.3B – $7.1B | +0.6% | ||
| Q4 2026 | $6.4B | $5.4B – $7.5B | -3.0% | ||
| Q1 2027 | $6.3B | $5.3B – $7.6B | +4.3% |
Seasonal Factors
| Fiscal Quarter | Seasonal Factor | vs Trend | Interpretation | Obs. |
|---|---|---|---|---|
| FQ1 (Sep–Nov) | 1.0465 | +4.7% | +4.7% above trend | 4 |
| FQ2 (Dec–Feb) | 1.0119 | +1.2% | In line with trend | 4 |
| FQ3 (Mar–May) | 1.0194 | +1.9% | In line with trend | 4 |
| FQ4 (Jun–Aug) | 1.011 | +1.1% | In line with trend | 4 |
How Spending Drives Revenue
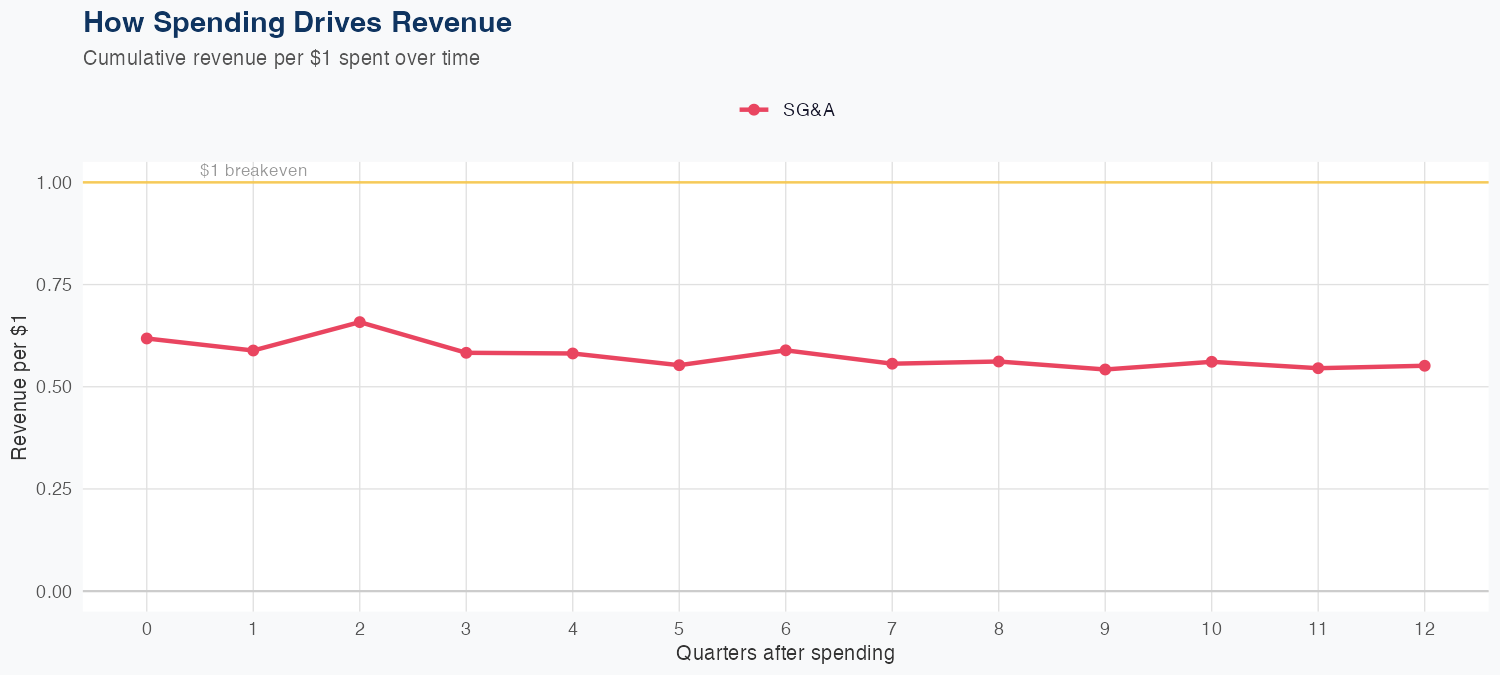
Spending Efficiency Over Time
Current SG&A multiplier: 0.6576
Want this analysis for your portfolio?
I build custom revenue intelligence reports for investors and companies using SEC filing data, econometric modeling, and AI-powered insights.
Get in Touch