Cms Energy Corporation CMS
Revenue Intelligence Report • 25 quarters of SEC filing data • Updated 2026-03-15
Revenue is projected to decline about 6% this year for CMS Energy, driven by near-term demand softness and limited offset from structural growth. Binding constraint: the ability to deploy incremental SG&A investment is the key bottleneck, given that elasticities are high and rising and our model indicates SG&A spend drives most topline growth. our econometric model shows SG&A spending is the principal growth lever, and the rising SG&A multiplier implies incremental spend translates into outsized topline gains, making execution capacity the binding constraint. Key risk: if CMS Energy cannot sustainably increase SG&A investment due to budget, regulatory, or organizational limits, the revenue outlook could deteriorate further.
Investment Thesis
Our ARDL model tracks Cms Energy Corporation's revenue with exceptional precision (2.4% MAPE), indicating highly predictable cash flows. Each $1 of SG&A spending generates $1.24 in revenue, reflecting strong commercial efficiency.
Revenue Forecast
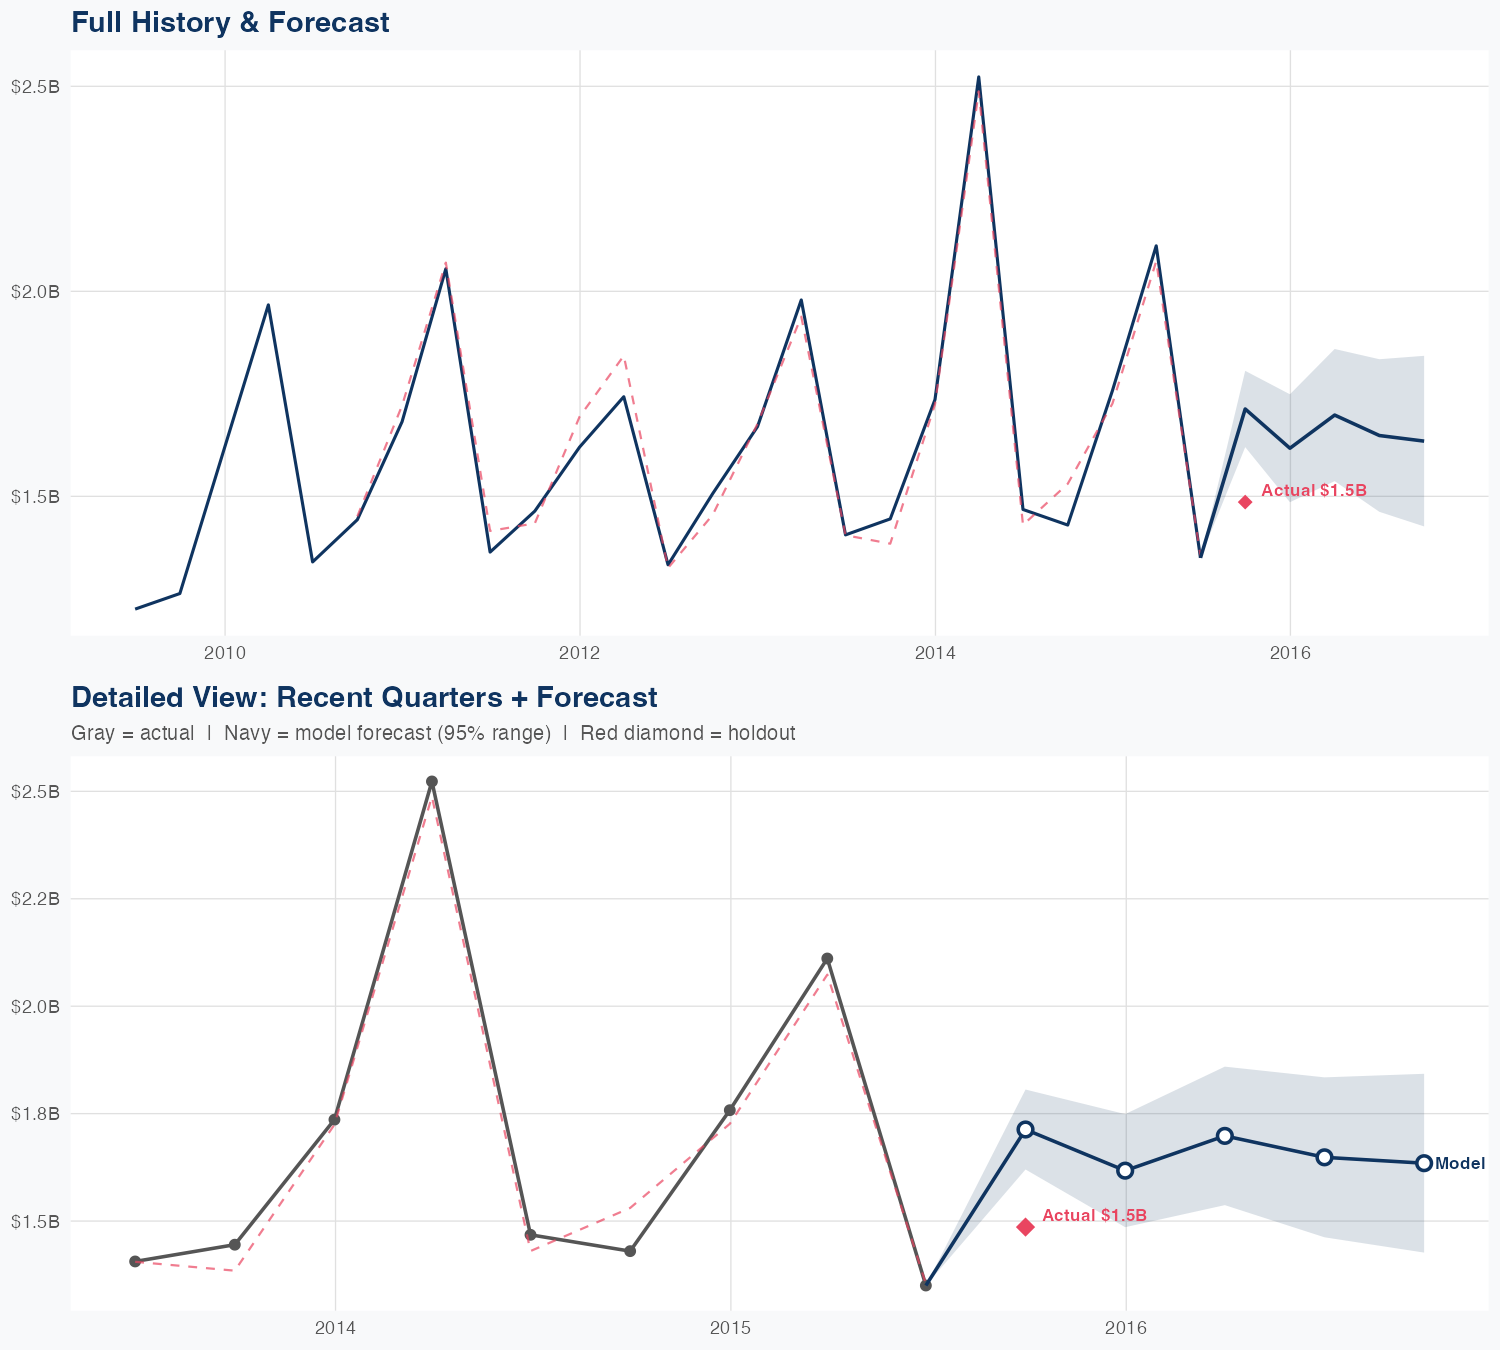
Quarterly Detail
| Quarter | Model Forecast | Actual | 95% Range | YoY Growth | Status |
|---|---|---|---|---|---|
| Q3 2015 | $1.4B | $1.5B | $1.3B – $1.6B | +0.6% | ✓ In range |
| Q4 2015 | $1.7B | $1.6B – $1.8B | -3.5% | ||
| Q2 2016 | $2.0B | $1.8B – $2.1B | -7.3% | ||
| Q3 2016 | $1.3B | $1.2B – $1.4B | -2.3% | ||
| Q4 2016 | $1.3B | $1.2B – $1.5B | -9.4% |
Seasonal Factors
| Fiscal Quarter | Seasonal Factor | vs Trend | Interpretation | Obs. |
|---|---|---|---|---|
| FQ1 (Sep–Nov) | 1.0356 | +3.6% | +3.6% above trend | 6 |
| FQ2 (Dec–Feb) | 0.9959 | -0.4% | In line with trend | 5 |
| FQ3 (Mar–May) | 1.0142 | +1.4% | In line with trend | 5 |
| FQ4 (Jun–Aug) | 1.0006 | +0.1% | In line with trend | 5 |
How Spending Drives Revenue
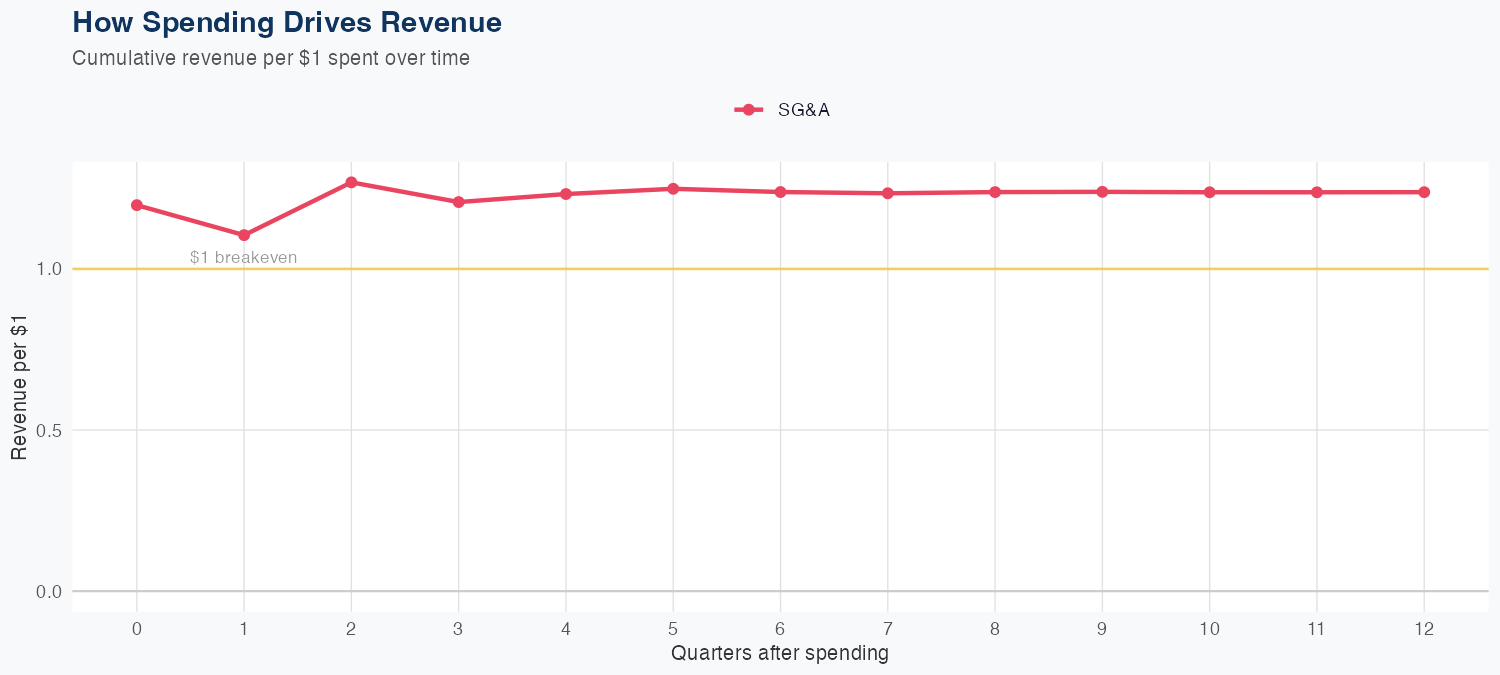
Spending Efficiency Over Time
Current SG&A multiplier: 0.9678
Want this analysis for your portfolio?
I build custom revenue intelligence reports for investors and companies using SEC filing data, econometric modeling, and AI-powered insights.
Get in Touch