Coupang, Inc. CPNG
Revenue Intelligence Report • 24 quarters of SEC filing data • Updated 2026-03-15
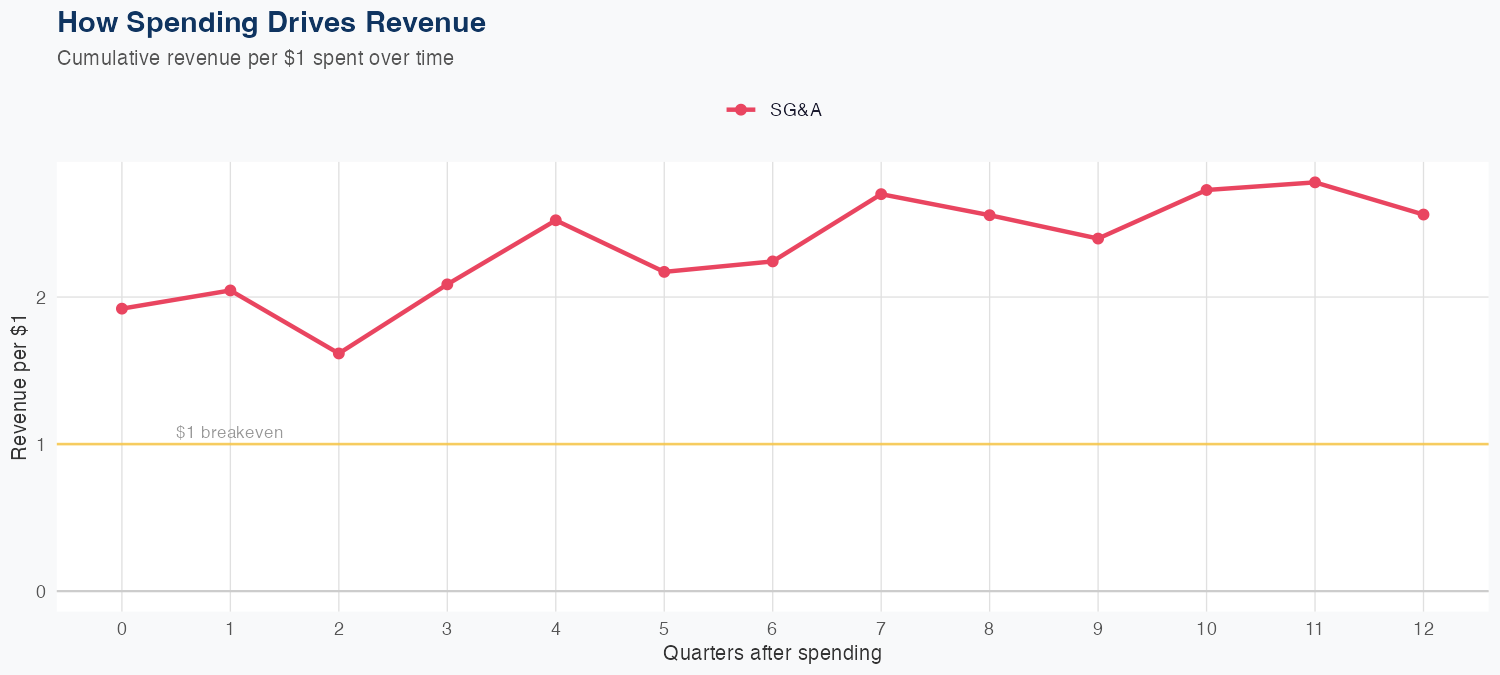
Revenue is driven primarily by SG&A efficiency, with $1 of SG&A spending generating $2.56 of long-run revenue, indicating a scalable growth engine in the current model. The approach uses a linear framework with a solid accuracy of 1.8% MAPE, and a holdout test showing a 4% miss (predicted 9.2B vs actual 8.8B), suggesting reliable forecasts. The latest quarterly revenue is 8.835B, and the full-year forecast is 40B, representing +16.1% year over year. Outlook: if the SG&A-to-revenue multiplier holds, disciplined SG&A investments can continue driving growth, but investors should monitor SG&A efficiency and external factors given no R&D input in the model.
Investment Thesis
Our ARDL model tracks Coupang, Inc.'s revenue with exceptional precision (1.8% MAPE), indicating highly predictable cash flows. Each $1 of SG&A spending generates $2.56 in revenue, reflecting strong commercial efficiency.
Revenue Forecast
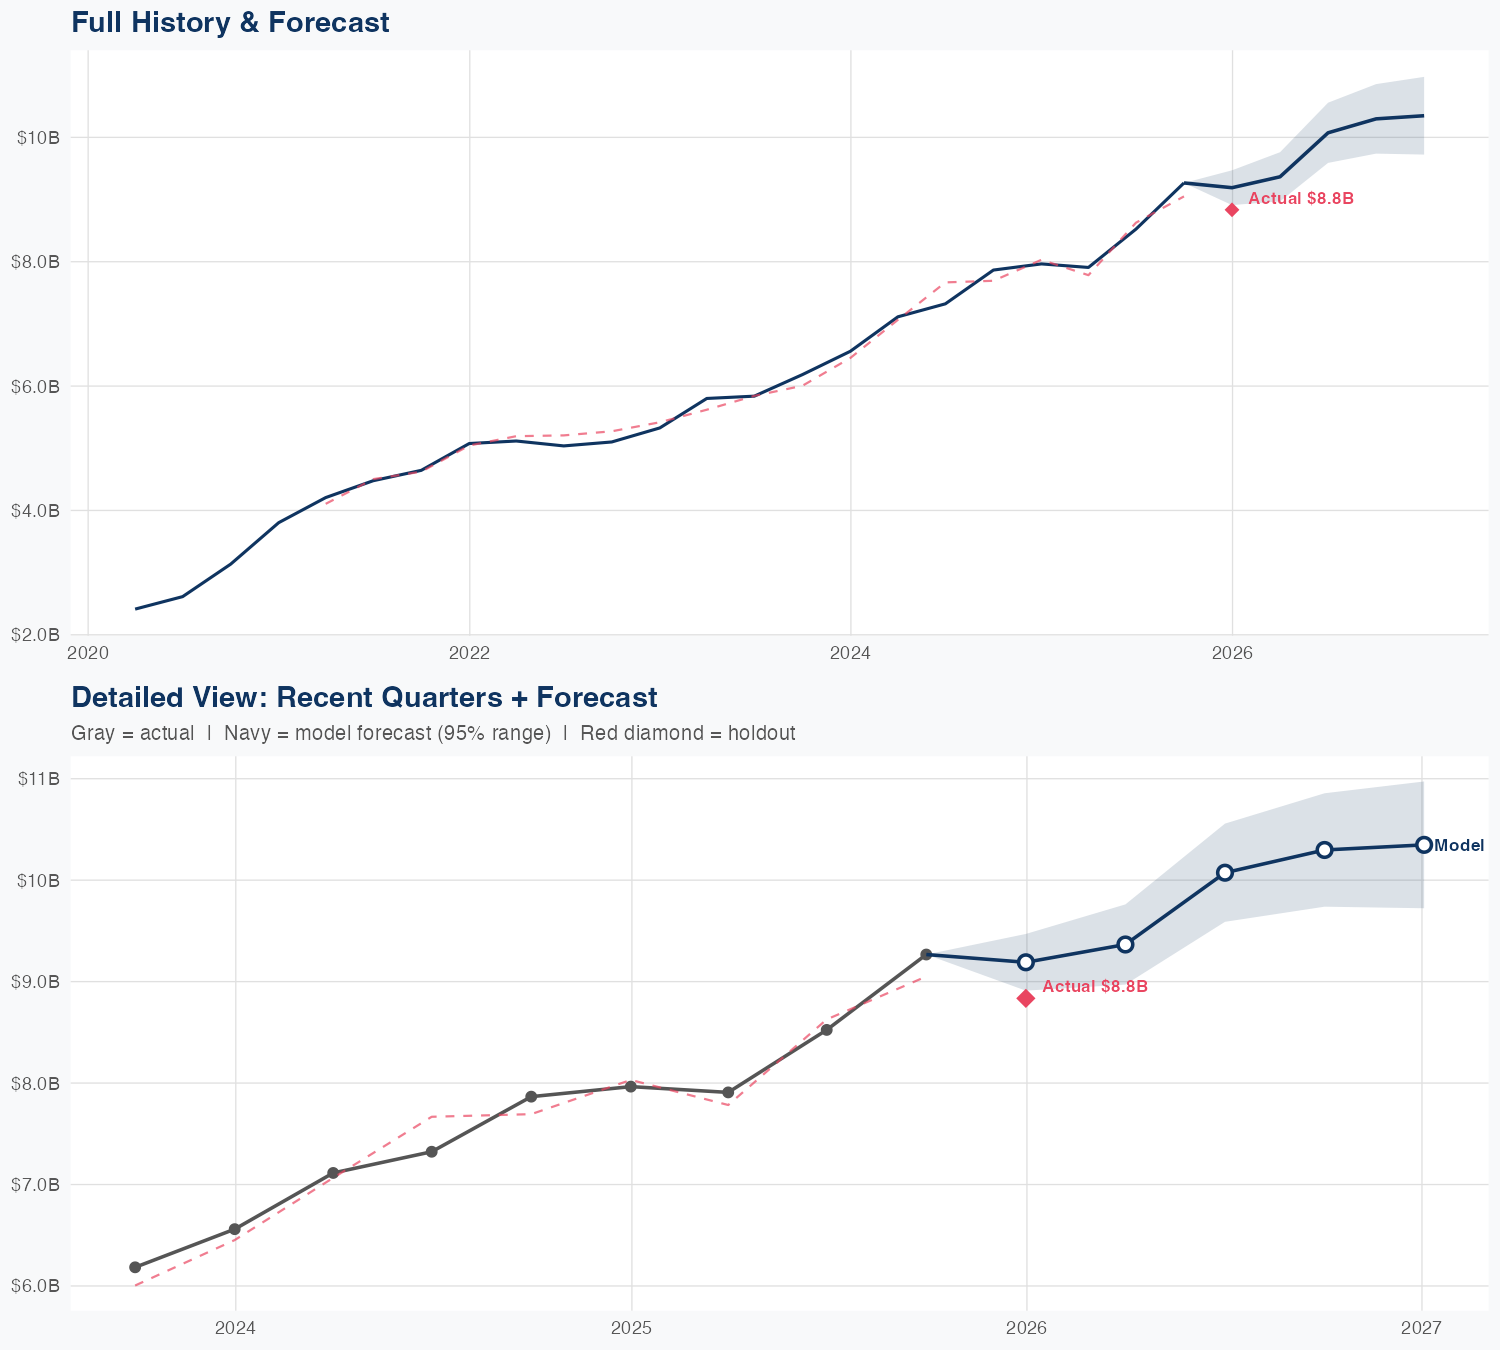
Quarterly Detail
| Quarter | Model Forecast | Actual | 95% Range | YoY Growth | Status |
|---|---|---|---|---|---|
| Q4 2025 | $9.2B | $8.8B | $8.9B – $9.5B | +15.4% | ✗ Outside range |
| Q2 2026 | $9.4B | $9.0B – $9.8B | +18.4% | ||
| Q3 2026 | $10B | $9.6B – $11B | +18.2% | ||
| Q4 2026 | $10B | $9.7B – $11B | +11.1% | ||
| Q1 2027 | $10B | $9.7B – $11B | +17.1% |
Seasonal Factors
| Fiscal Quarter | Seasonal Factor | vs Trend | Interpretation | Obs. |
|---|---|---|---|---|
| FQ1 (Sep–Nov) | 1.0224 | +2.2% | In line with trend | 5 |
| FQ2 (Dec–Feb) | 0.9918 | -0.8% | In line with trend | 5 |
| FQ3 (Mar–May) | 1.016 | +1.6% | In line with trend | 5 |
| FQ4 (Jun–Aug) | 0.988 | -1.2% | In line with trend | 5 |
How Spending Drives Revenue
Want this analysis for your portfolio?
I build custom revenue intelligence reports for investors and companies using SEC filing data, econometric modeling, and AI-powered insights.
Get in Touch