Cheniere Energy Partners, L.p. CQP
Revenue Intelligence Report • 37 quarters of SEC filing data • Updated 2026-03-15
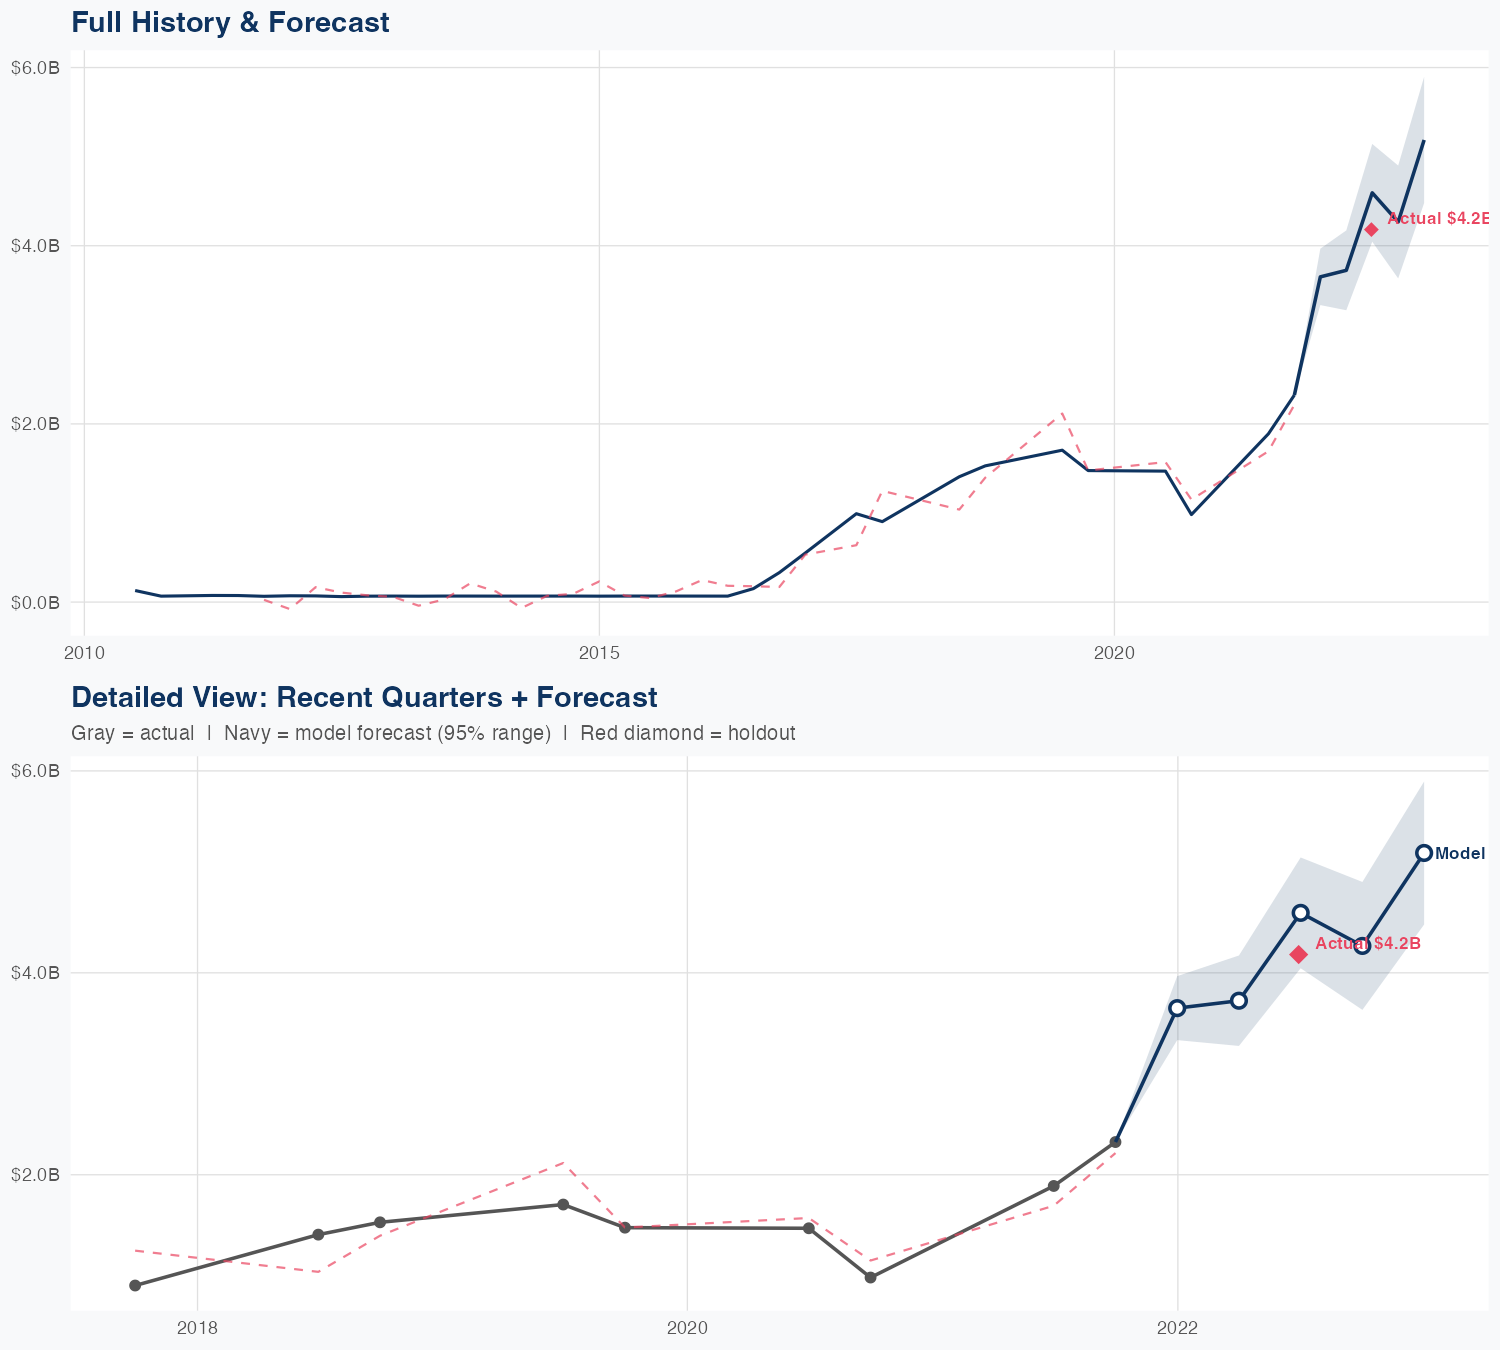
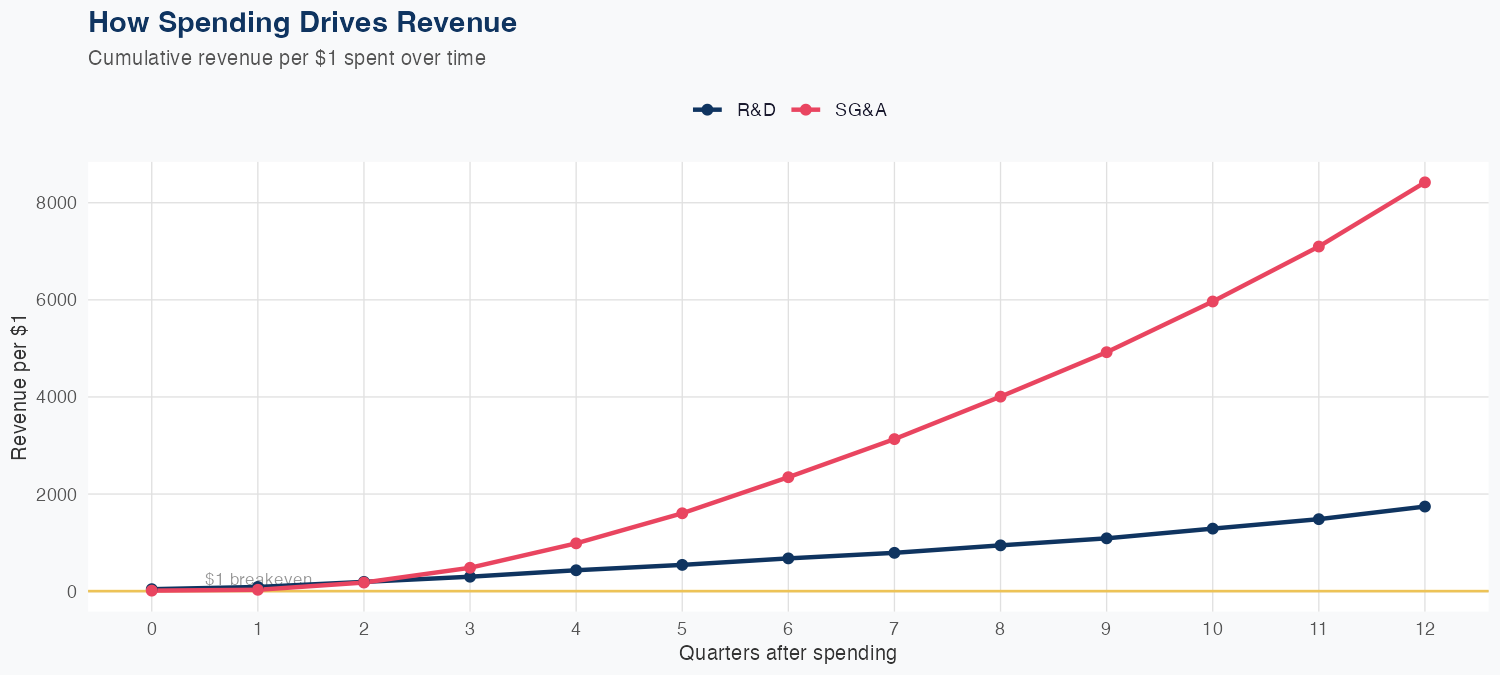
The model indicates revenue will be driven by spending profiles, with long-run revenue contributions of $1 of R&D yielding $1,742.47 and $1 of SG&A yielding $8,419.90. In the latest quarter, revenue was $4,181 million, reflecting the spend-driven framework across 37 quarters of data. The model is linear with 70.1% MAPE accuracy, and a holdout test produced a predicted $3.7B versus actual $4.2B (12.7% error), indicating notable forecast uncertainty. The FY revenue forecast is $18B, up 89.5% year over year, signaling a strong growth trajectory but with material sensitivity to spend mix and model risk that investors should monitor.
Investment Thesis
At 70.1% MAPE, the model captures Cheniere Energy Partners, L.p.'s broad revenue trajectory, though quarterly variability suggests sensitivity to external factors. Every $1 of R&D investment is associated with $1742.47 of revenue, indicating efficient capital deployment in innovation. Each $1 of SG&A spending generates $8419.90 in revenue, reflecting strong commercial efficiency.
Revenue Forecast
Quarterly Detail
| Quarter | Model Forecast | Actual | 95% Range | YoY Growth | Status |
|---|---|---|---|---|---|
| Q4 2021 | $3.7B | $4.2B | $3.3B – $4.0B | +148.3% | ✗ Outside range |
| Q2 2022 | $3.7B | $3.3B – $4.2B | +279.2% | ||
| Q3 2022 | $4.6B | $4.0B – $5.1B | +143.2% | ||
| Q4 2022 | $4.3B | $3.6B – $4.9B | +83.6% | ||
| Q1 2023 | $5.2B | $4.5B – $5.9B | +24.1% |
Seasonal Factors
| Fiscal Quarter | Seasonal Factor | vs Trend | Interpretation | Obs. |
|---|---|---|---|---|
| FQ1 (Sep–Nov) | 0.8739 | -12.6% | -12.6% below trend | 11 |
| FQ2 (Dec–Feb) | 0.5671 | -43.3% | -43.3% below trend | 5 |
| FQ3 (Mar–May) | 0.4138 | -58.6% | -58.6% below trend | 3 |
| FQ4 (Jun–Aug) | 1.0271 | +2.7% | In line with trend | 11 |
How Spending Drives Revenue
Want this analysis for your portfolio?
I build custom revenue intelligence reports for investors and companies using SEC filing data, econometric modeling, and AI-powered insights.
Get in Touch