Credo Technology Group Holding Ltd CRDO
Revenue Intelligence Report • 16 quarters of SEC filing data • Updated 2026-03-15
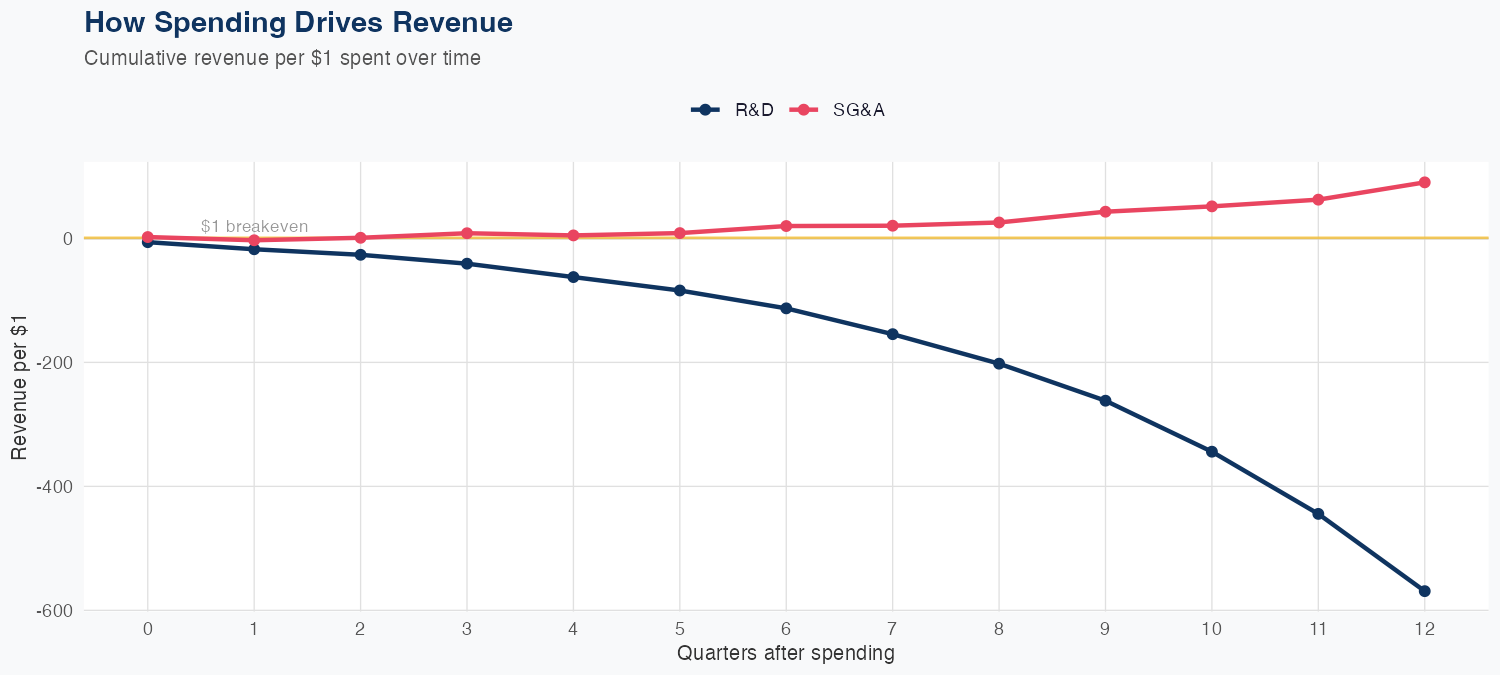
Quarterly revenue is $407 million, based on a linear model trained on 16 quarters of data. The model implies a strong positive long-run revenue impact from SG&A spending (about $90.41 per dollar) and a negative long-run impact from R&D spending (about -$569.04 per dollar), making SG&A a primary growth driver while R&D appears to be a drag in this framework. The holdout test predicted $0.5B versus actual $0.4B (−11.1% error) with an overall MAPE of 8.9%, indicating reasonable but imperfect predictive accuracy. The FY forecast of $5.1B revenue, up roughly 392.6% year over year, signals a steep growth trajectory if these drivers persist, though the outlook hinges on SG&A-led expansion and the negative R&D signal in the model.
Investment Thesis
At 8.9% MAPE, the model captures Credo Technology Group Holding Ltd's broad revenue trajectory, though quarterly variability suggests sensitivity to external factors. Each $1 of SG&A spending generates $90.41 in revenue, reflecting strong commercial efficiency.
Revenue Forecast
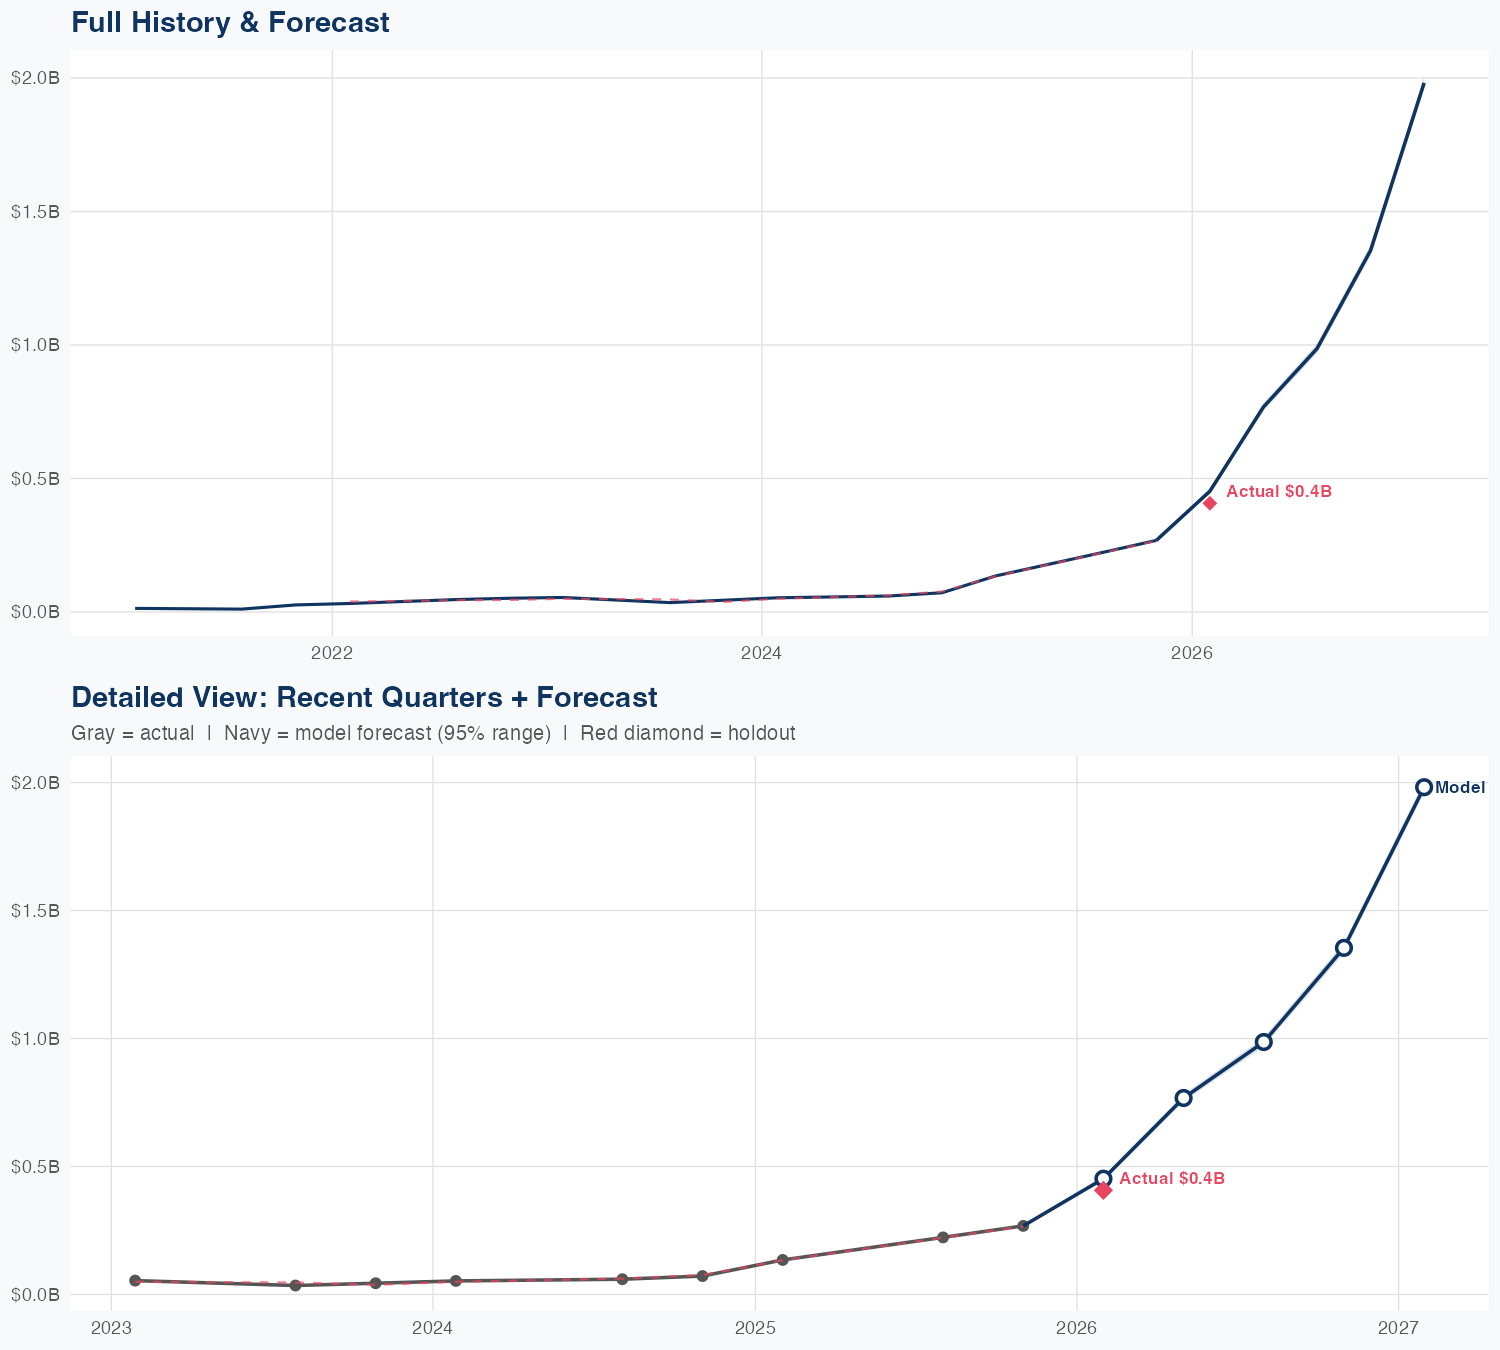
Quarterly Detail
| Quarter | Model Forecast | Actual | 95% Range | YoY Growth | Status |
|---|---|---|---|---|---|
| Q1 2026 | $0.5B | $0.4B | $0.4B – $0.5B | +528.0% | ✗ Outside range |
| Q2 2026 | $0.8B | $0.8B – $0.8B | +468.6% | ||
| Q3 2026 | $1.0B | $1.0B – $1.0B | +342.2% | ||
| Q4 2026 | $1.4B | $1.3B – $1.4B | +405.2% | ||
| Q1 2027 | $2.0B | $2.0B – $2.0B | +386.9% |
Seasonal Factors
| Fiscal Quarter | Seasonal Factor | vs Trend | Interpretation | Obs. |
|---|---|---|---|---|
| FQ1 (Sep–Nov) | 1.1453 | +14.5% | +14.5% above trend | 4 |
| FQ2 (Dec–Feb) | 1.0089 | +0.9% | In line with trend | 5 |
| FQ3 (Mar–May) | 1.0 | +0.0% | In line with trend | 0 |
| FQ4 (Jun–Aug) | 1.0039 | +0.4% | In line with trend | 4 |
How Spending Drives Revenue
Want this analysis for your portfolio?
I build custom revenue intelligence reports for investors and companies using SEC filing data, econometric modeling, and AI-powered insights.
Get in Touch