Coreweave, Inc CRWV
Revenue Intelligence Report • 8 quarters of SEC filing data • Updated 2026-03-15
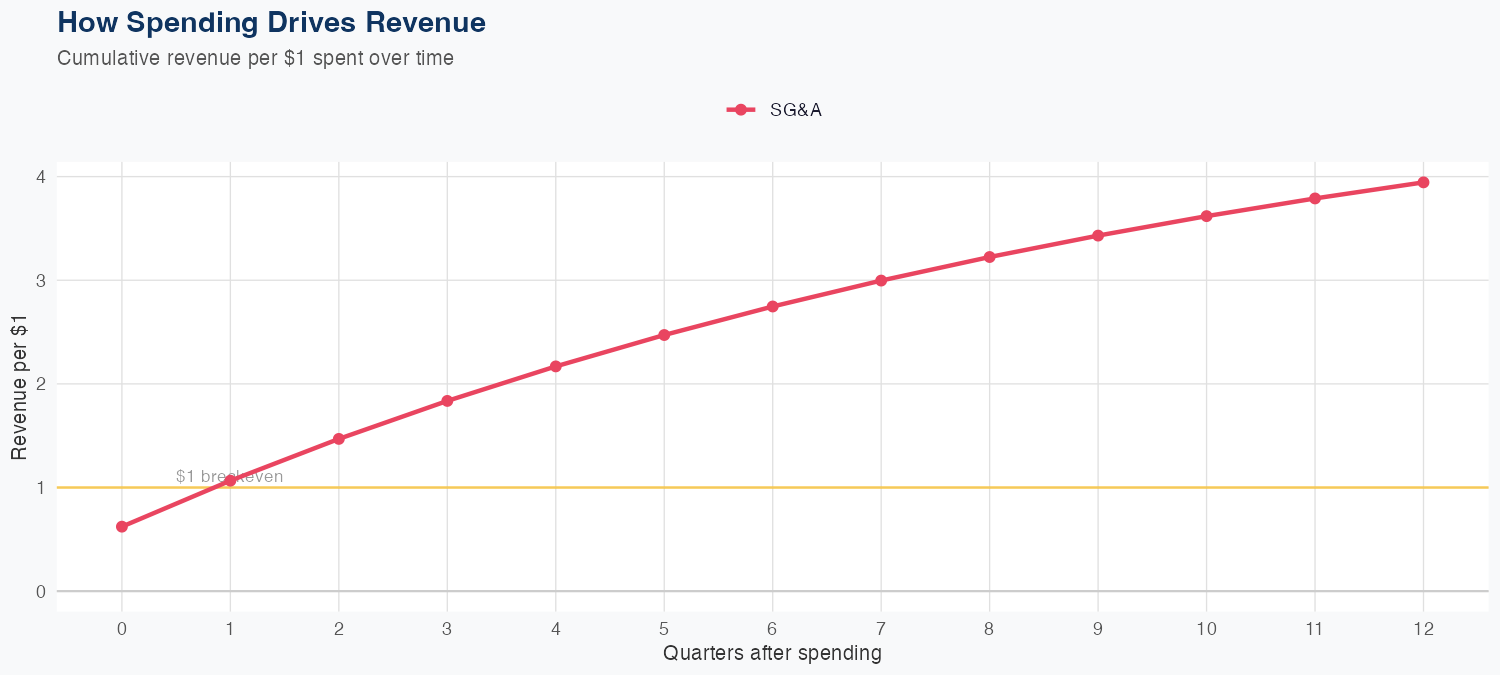
The latest quarterly revenue stands at $1.572 billion, and eight quarters of data support a full-year forecast of $8.4 billion, a 63.1% year-over-year increase. A key revenue driver is SG&A efficiency, with every $1 of SG&A spending generating about $3.94 of long-run revenue, indicating strong ROI on operating expenditures. The model is linear with 1.5% MAPE, and a holdout test predicted $1.6B versus actual $1.6B (−0.2% error), reinforcing forecast reliability. The outlook remains robust, but investors should note the absence of R&D data and monitor whether SG&A-driven growth remains sustainable over the longer term.
Investment Thesis
Our ARDL model tracks Coreweave, Inc's revenue with exceptional precision (1.5% MAPE), indicating highly predictable cash flows. Each $1 of SG&A spending generates $3.94 in revenue, reflecting strong commercial efficiency.
Revenue Forecast
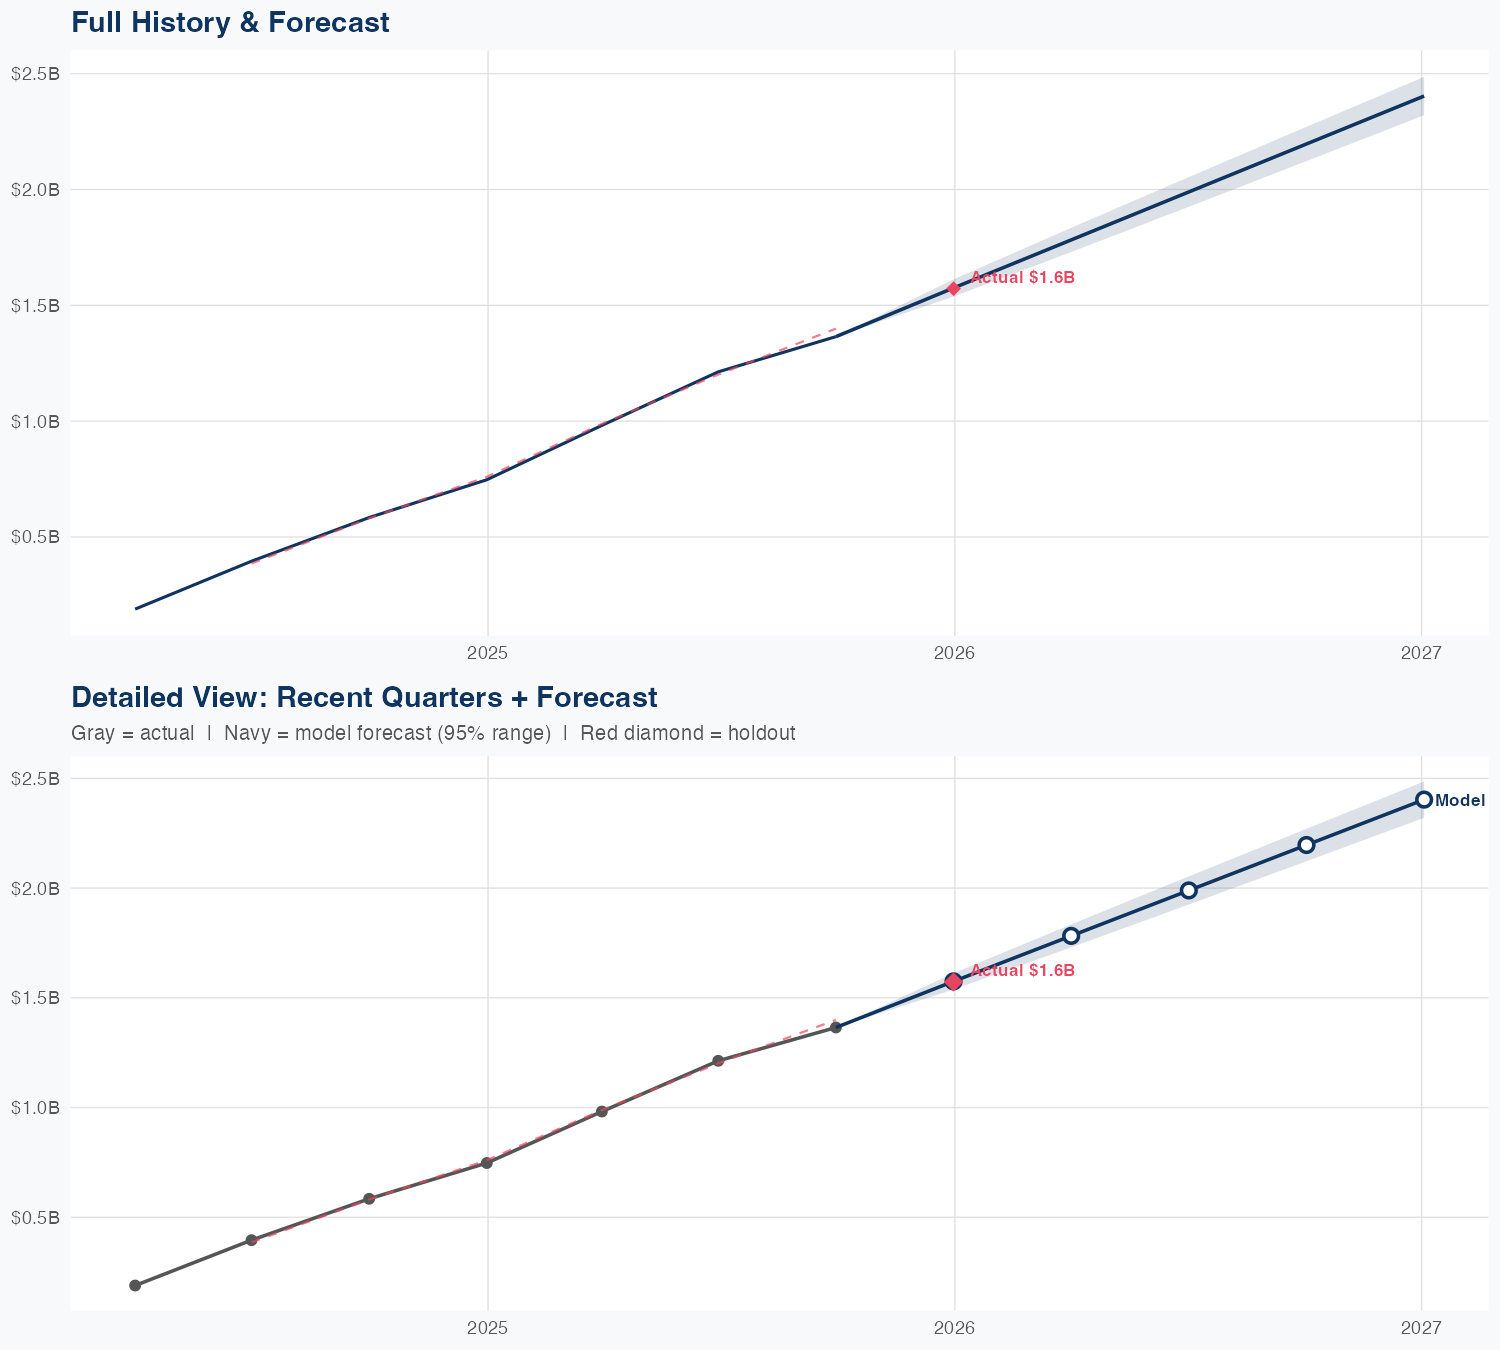
Quarterly Detail
| Quarter | Model Forecast | Actual | 95% Range | YoY Growth | Status |
|---|---|---|---|---|---|
| Q4 2025 | $1.6B | $1.6B | $1.5B – $1.6B | +110.8% | ✓ In range |
| Q2 2026 | $1.8B | $1.7B – $1.8B | +81.6% | ||
| Q3 2026 | $2.0B | $1.9B – $2.1B | +64.0% | ||
| Q4 2026 | $2.2B | $2.1B – $2.3B | +60.9% | ||
| Q1 2027 | $2.4B | $2.3B – $2.5B | +52.9% |
How Spending Drives Revenue
Want this analysis for your portfolio?
I build custom revenue intelligence reports for investors and companies using SEC filing data, econometric modeling, and AI-powered insights.
Get in Touch