Csx Corporation CSX
Revenue Intelligence Report • 65 quarters of SEC filing data • Updated 2026-03-15
CSX's revenue is forecast to decline about 2.6% year over year to around $13.4 billion, with structural growth drivers helping to cushion the downside and point toward stabilization. Binding constraint is network delivery capacity—the track and terminal capacity and equipment (locomotives/railcars) availability that cap incremental volume and revenue upside. In our econometric model, structural/platform growth accounts for about 38% of the current revenue growth signal, SG&A spending 62%, and R&D spending 0%, with SG&A elasticity drifting lower over time and signaling rising operating leverage as growth shifts from spending to scale and pricing power. Key risk: a sustained capacity constraint or a demand shock that drags freight volumes could keep earnings and revenue growth below forecast.
Investment Thesis
The econometric model achieves strong accuracy (3.6% MAPE), suggesting Csx Corporation's revenue trajectory is well-characterized by its spending patterns.
Revenue Forecast
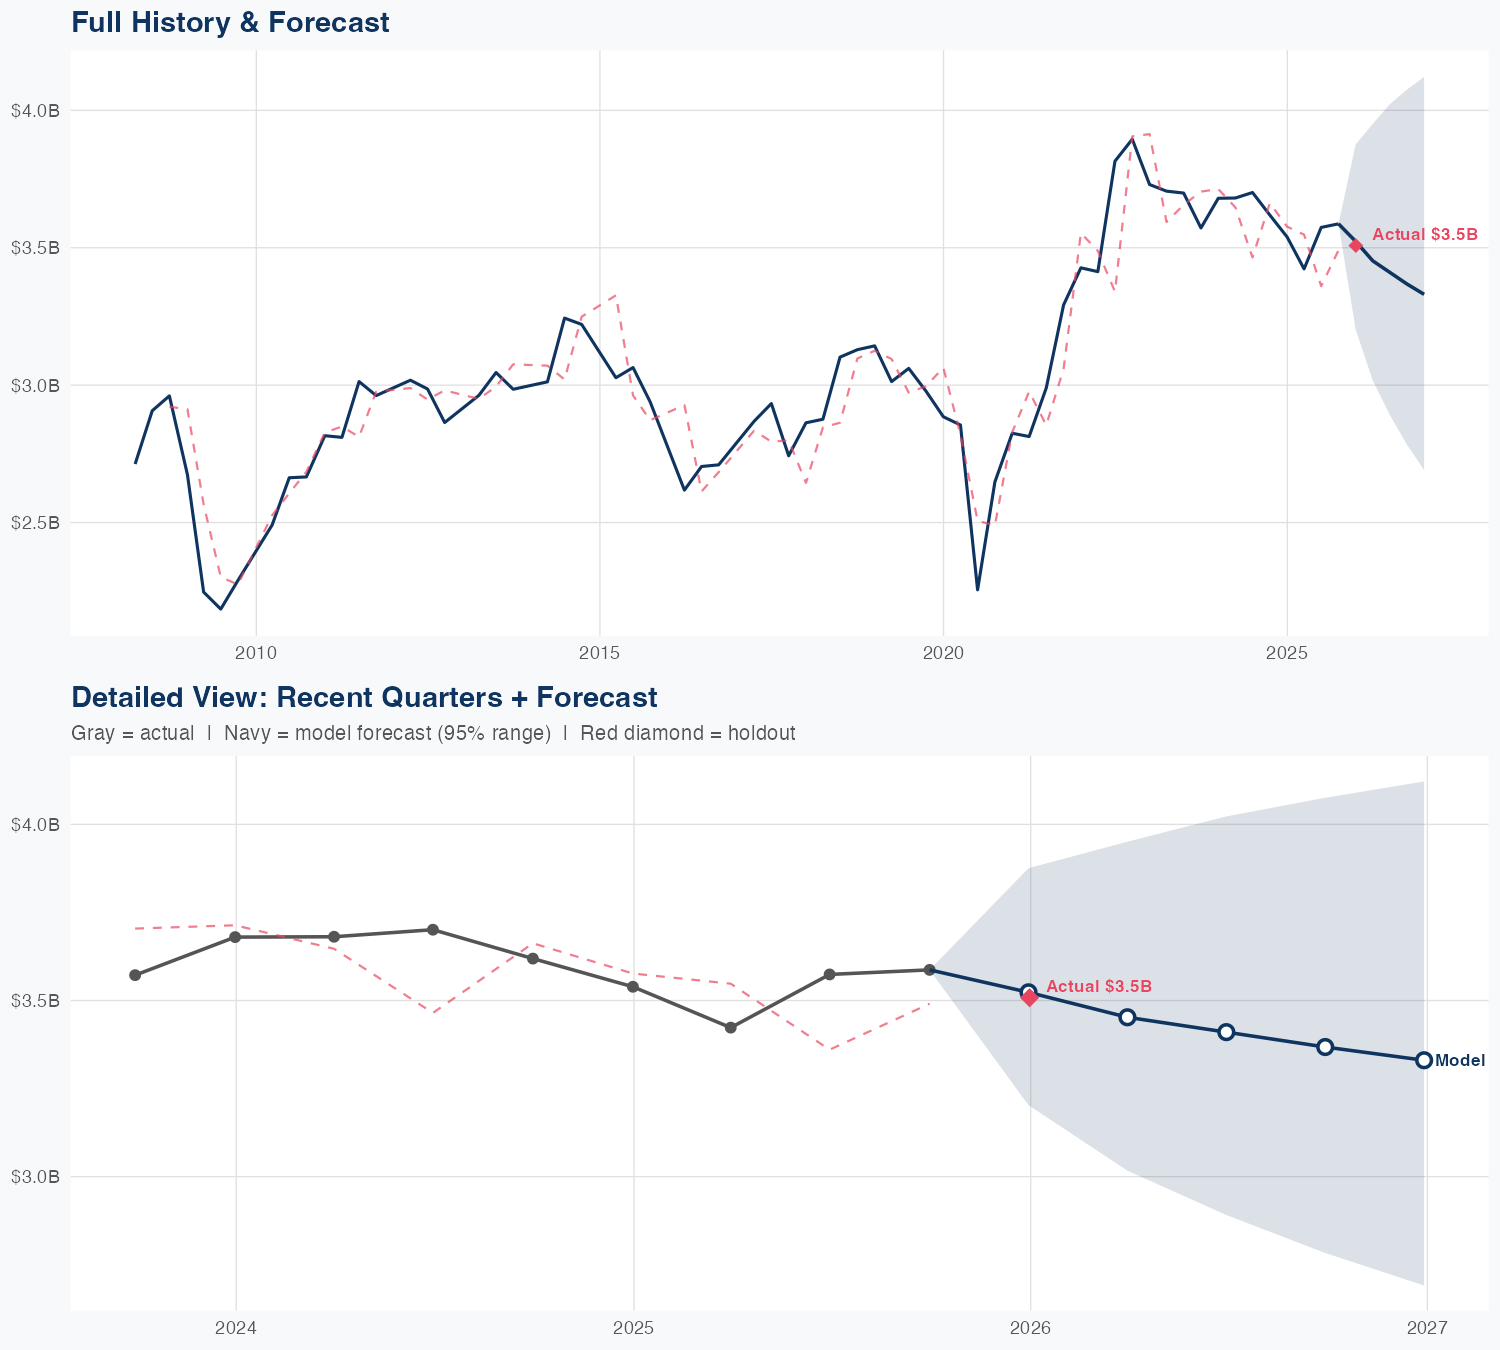
Quarterly Detail
| Quarter | Model Forecast | Actual | 95% Range | YoY Growth | Status |
|---|---|---|---|---|---|
| Q4 2025 | $3.5B | $3.5B | $3.2B – $3.8B | -1.3% | ✓ In range |
| Q1 2026 | $3.5B | $3.1B – $4.0B | +2.3% | ||
| Q2 2026 | $3.4B | $2.9B – $4.0B | -4.7% | ||
| Q3 2026 | $3.4B | $2.8B – $4.1B | -5.7% | ||
| Q4 2026 | $3.4B | $2.8B – $4.2B | -2.3% |
Seasonal Factors
| Fiscal Quarter | Seasonal Factor | vs Trend | Interpretation | Obs. |
|---|---|---|---|---|
| FQ1 (Sep–Nov) | 0.9974 | -0.3% | In line with trend | 18 |
| FQ2 (Dec–Feb) | 0.9895 | -1.1% | In line with trend | 11 |
| FQ3 (Mar–May) | 0.986 | -1.4% | In line with trend | 17 |
| FQ4 (Jun–Aug) | 1.0348 | +3.5% | +3.5% above trend | 17 |
How Spending Drives Revenue
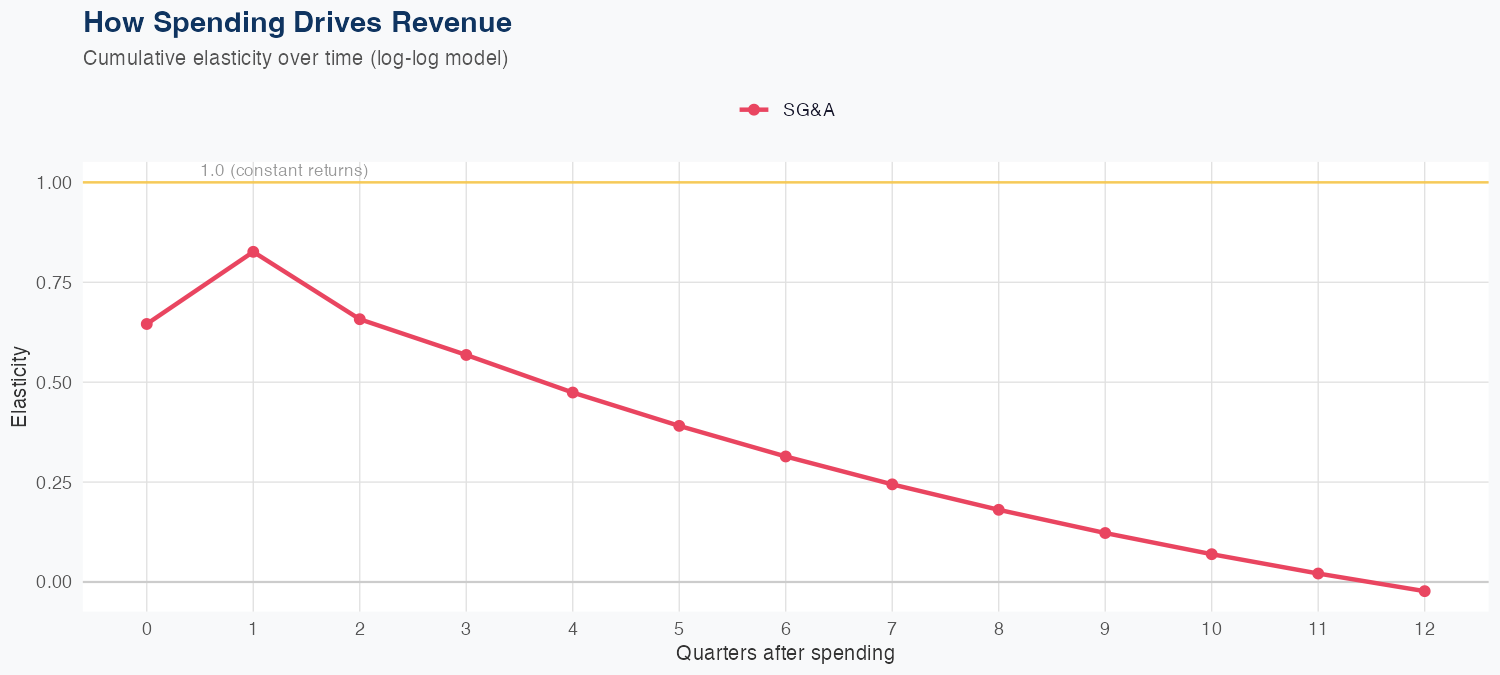
Spending Efficiency Over Time
Current SG&A elasticity: 0.6825x
Want this analysis for your portfolio?
I build custom revenue intelligence reports for investors and companies using SEC filing data, econometric modeling, and AI-powered insights.
Get in Touch