Coterra Energy Inc. CTRA
Revenue Intelligence Report • 70 quarters of SEC filing data • Updated 2026-03-15
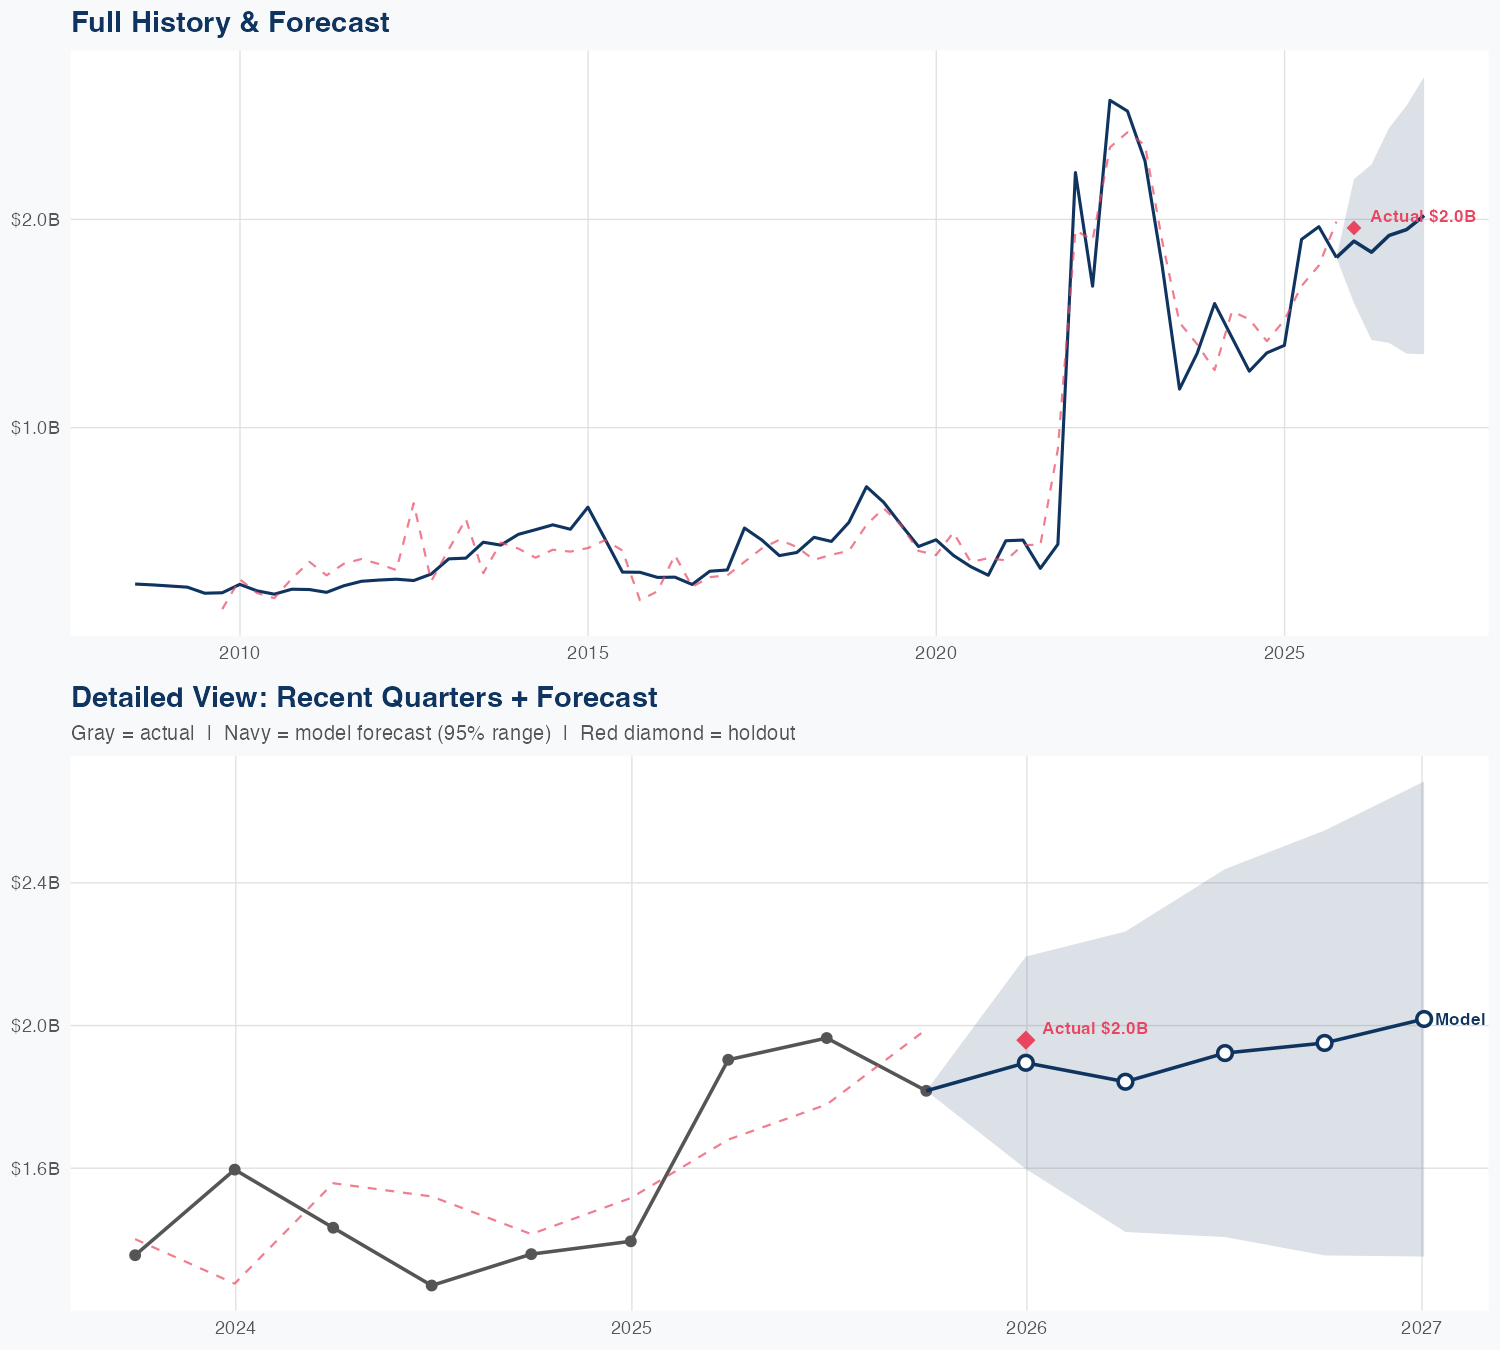
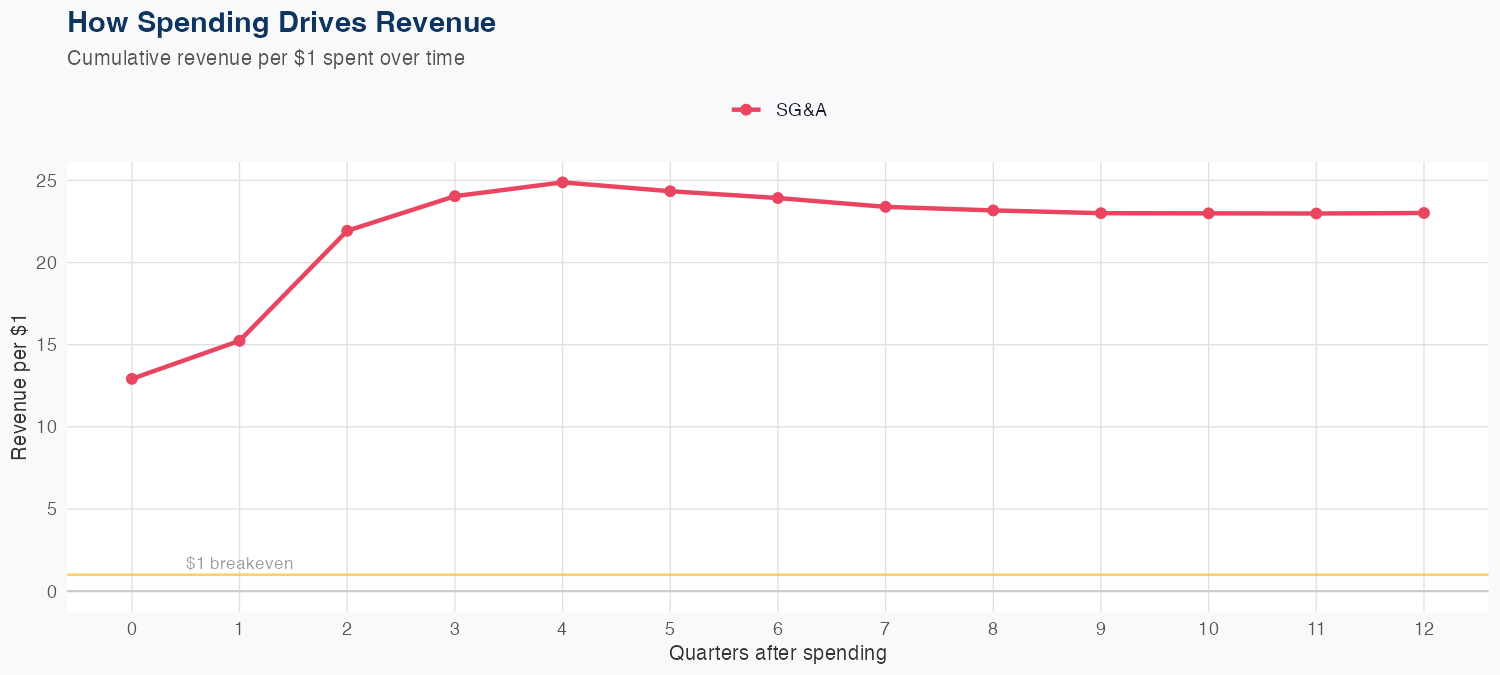
Revenue is driven by energy production volumes and realized prices, with the latest quarterly revenue near $1.96 billion. The model shows exceptionally strong SG&A efficiency, with $1 of SG&A generating about $23.02 of long-run revenue, implying a high ROI on non-production costs. Forecasting performance is reasonably close on holdout (predicted $1.9B vs actual $2.0B, 3.2% error), and the full-year revenue is projected at $7.7B, up about 1.2% year over year. Overall, the outlook suggests modest, stable growth supported by efficient SG&A, but investors should note the model’s 21.8% MAPE and potential volatility in energy markets.
Investment Thesis
At 21.8% MAPE, the model captures Coterra Energy Inc.'s broad revenue trajectory, though quarterly variability suggests sensitivity to external factors. Each $1 of SG&A spending generates $23.02 in revenue, reflecting strong commercial efficiency.
Revenue Forecast
Quarterly Detail
| Quarter | Model Forecast | Actual | 95% Range | YoY Growth | Status |
|---|---|---|---|---|---|
| Q4 2025 | $1.9B | $2.0B | $1.6B – $2.2B | +35.9% | ✓ In range |
| Q2 2026 | $1.8B | $1.4B – $2.3B | -3.2% | ||
| Q3 2026 | $1.9B | $1.4B – $2.4B | -2.1% | ||
| Q4 2026 | $2.0B | $1.4B – $2.5B | +7.4% | ||
| Q1 2027 | $2.0B | $1.4B – $2.7B | +3.0% |
Seasonal Factors
| Fiscal Quarter | Seasonal Factor | vs Trend | Interpretation | Obs. |
|---|---|---|---|---|
| FQ1 (Sep–Nov) | 0.9726 | -2.7% | In line with trend | 17 |
| FQ2 (Dec–Feb) | 1.142 | +14.2% | +14.2% above trend | 17 |
| FQ3 (Mar–May) | 1.0111 | +1.1% | In line with trend | 16 |
| FQ4 (Jun–Aug) | 1.0477 | +4.8% | +4.8% above trend | 16 |
How Spending Drives Revenue
Want this analysis for your portfolio?
I build custom revenue intelligence reports for investors and companies using SEC filing data, econometric modeling, and AI-powered insights.
Get in Touch