Cvs Health Corporation CVS
Revenue Intelligence Report • 15 quarters of SEC filing data • Updated 2026-03-15
Revenue is projected to grow about 38% year over year, driven by platform-scale care-delivery growth and sustained strength across its pharmacy and retail franchises. The binding constraint on further growth appears to be capacity in CVS’s operating network—pharmacy fulfillment and MinuteClinic/clinic capacity and staffing—limiting incremental revenue despite favorable ROI signals. Our econometric model attributes growth roughly 18% to structural/platform expansion, 18% to SG&A investment, and 64% to R&D spending, with SG&A ROI at -$11.64 per $1 spent and R&D ROI at +$63.28 per $1 spent. MAPE is 0.4% and the holdout result matches at 0%, underscoring the reliability of the structural drivers and the durable contribution from platform and R&D. Key risk: ongoing capacity constraints in the CVS network—labor shortages or service bottlenecks in pharmacies and clinics—that could impede the revenue uplift from demand growth.
Investment Thesis
Our ARDL model tracks Cvs Health Corporation's revenue with exceptional precision (0.4% MAPE), indicating highly predictable cash flows. Every $1 of R&D investment is associated with $63.28 of revenue, indicating efficient capital deployment in innovation.
Revenue Forecast
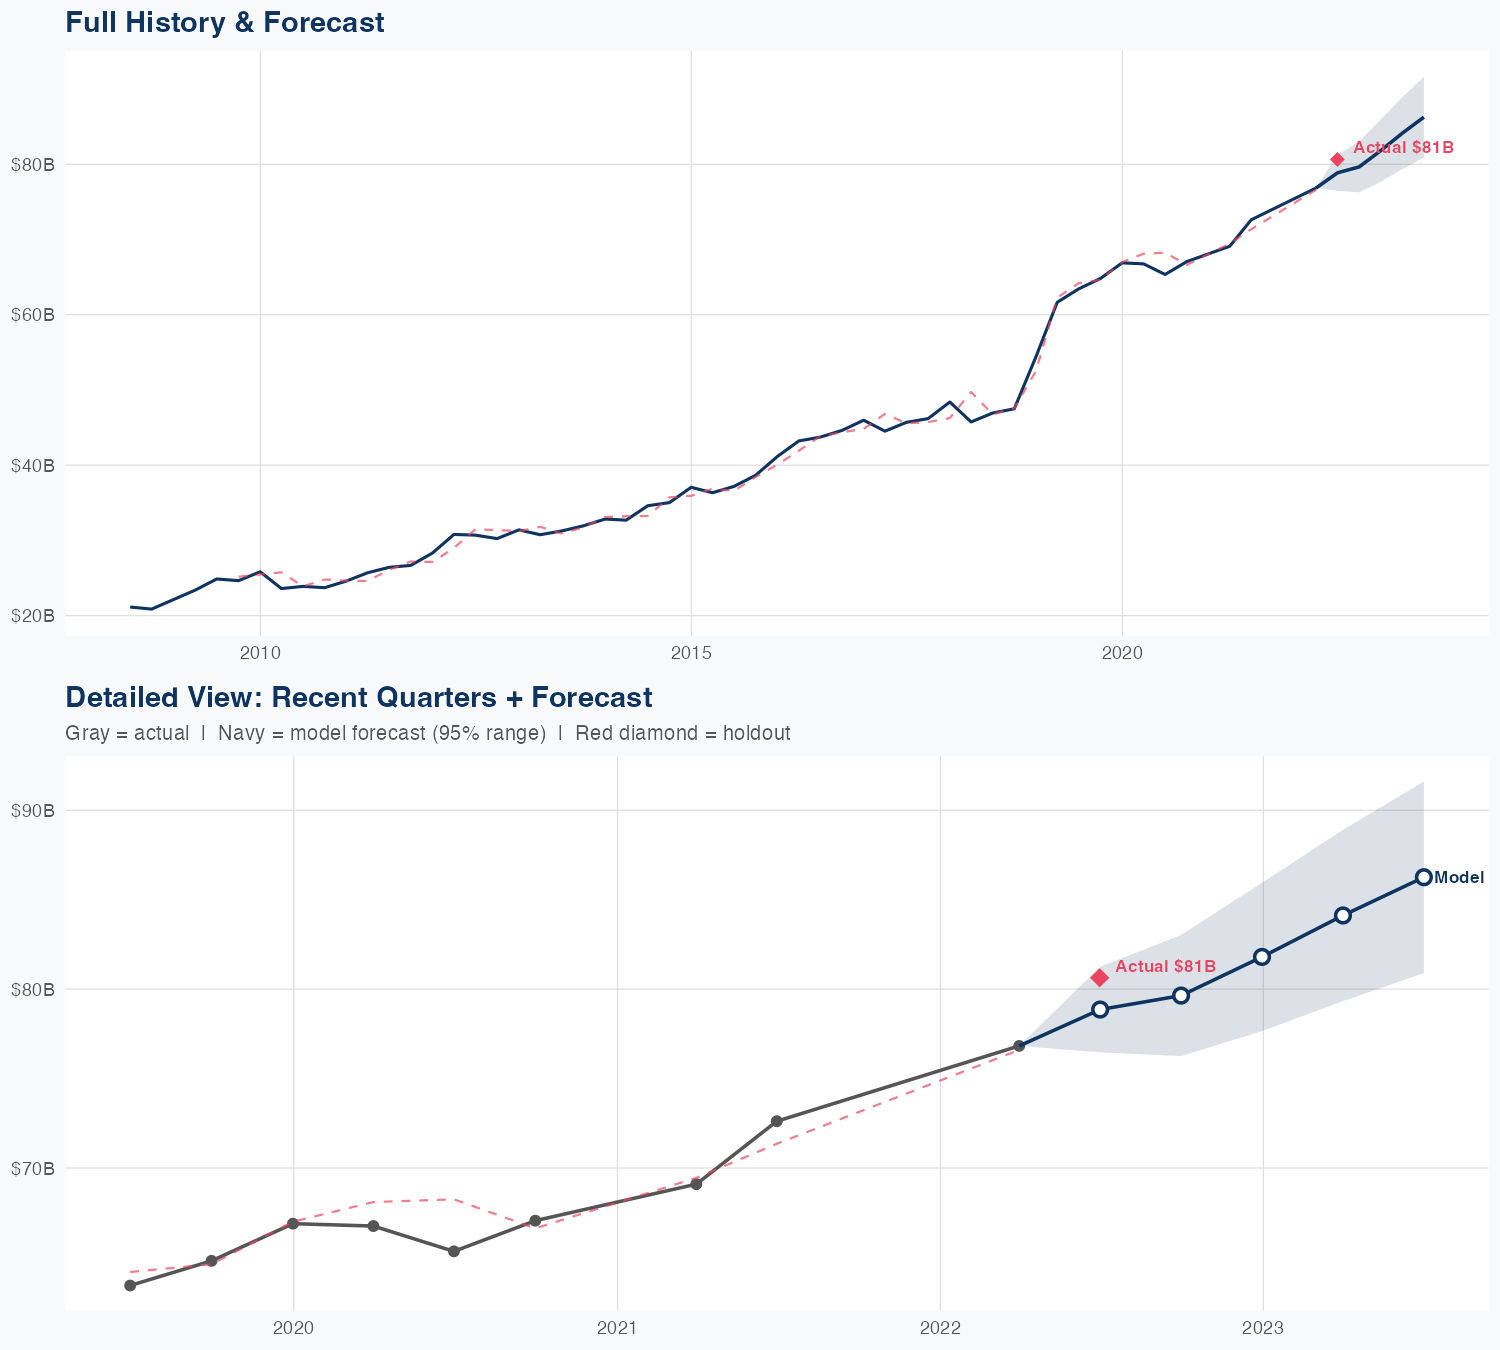
Quarterly Detail
| Quarter | Model Forecast | Actual | 95% Range | YoY Growth | Status |
|---|---|---|---|---|---|
| Q2 2022 | $81B | $81B | $80B – $81B | +20.2% | ✓ In range |
| Q3 2022 | $86B | $85B – $87B | +24.5% | ||
| Q4 2022 | $96B | $95B – $98B | +32.8% | ||
| Q2 2023 | $108B | $107B – $110B | +41.0% | ||
| Q3 2023 | $121B | $120B – $123B | +50.2% |
Seasonal Factors
| Fiscal Quarter | Seasonal Factor | vs Trend | Interpretation | Obs. |
|---|---|---|---|---|
| FQ1 (Sep–Nov) | 1.0009 | +0.1% | In line with trend | 3 |
| FQ2 (Dec–Feb) | 1.0104 | +1.0% | In line with trend | 2 |
| FQ3 (Mar–May) | 1.0003 | +0.0% | In line with trend | 4 |
| FQ4 (Jun–Aug) | 0.9965 | -0.3% | In line with trend | 4 |
How Spending Drives Revenue
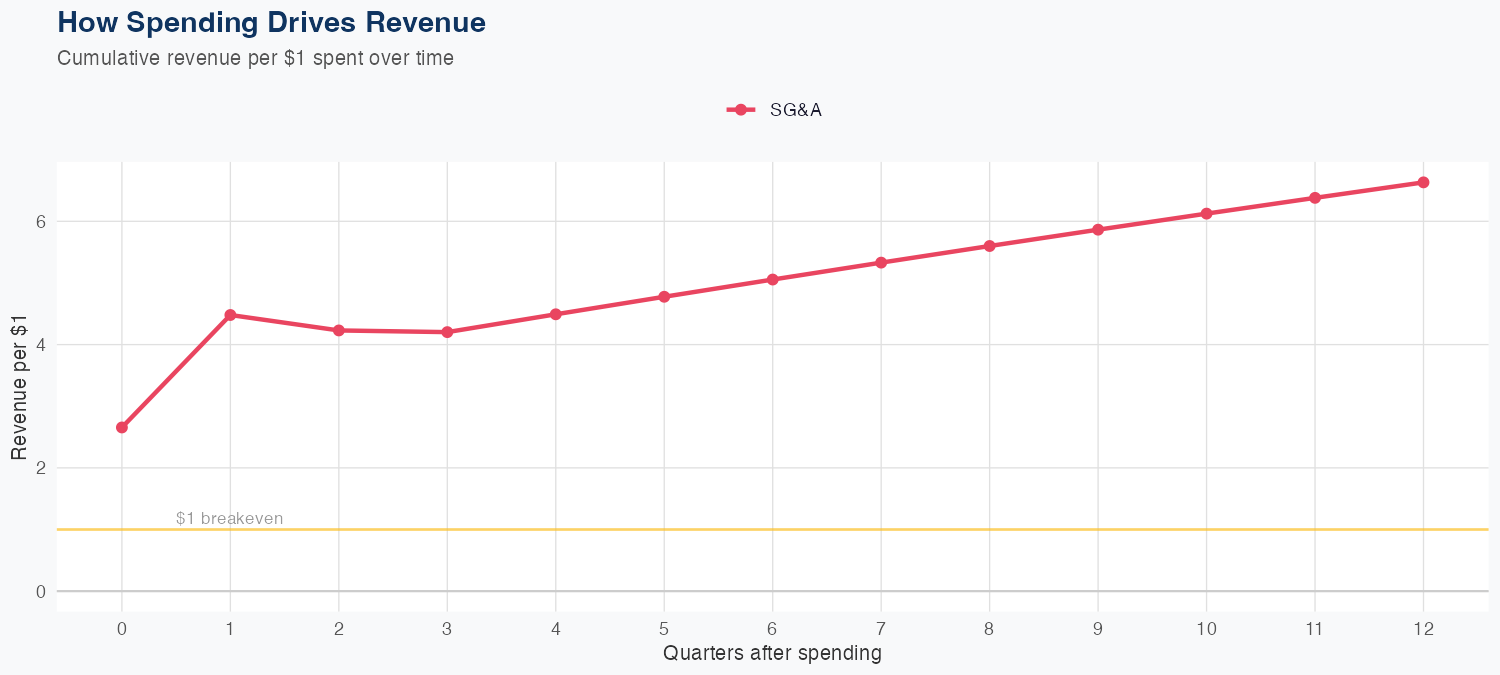
Spending Efficiency Over Time
Current SG&A multiplier: 0.0861 • R&D: 0.3044
Want this analysis for your portfolio?
I build custom revenue intelligence reports for investors and companies using SEC filing data, econometric modeling, and AI-powered insights.
Get in Touch