Dominion Energy, Inc. D
Revenue Intelligence Report • 70 quarters of SEC filing data • Updated 2026-03-15
Dominion Energy's revenue is forecast to decline about 2% year over year to roughly $16.1 billion in the coming year. Our econometric model shows the growth is driven mostly by structural/platform effects (about 70%), with SG&A contributing the remainder and R&D essentially zero. The binding constraint appears to be regulatory approvals and rate-case cycles that cap allowable revenue growth; the company relies on platform scale and pricing power to lift top-line results, but rate decisions will set the ceiling. SG&A elasticity has trended lower (moving toward zero), reinforcing the view that incremental spend is maintenance rather than the growth lever. Key risk: regulatory/rate-order risk—unexpected rate adjustments, delays in capex approvals, or tighter allowed returns could materially limit revenue upside.
Investment Thesis
The econometric model achieves strong accuracy (6.2% MAPE), suggesting Dominion Energy, Inc.'s revenue trajectory is well-characterized by its spending patterns. Sales & marketing spend shows a 0.59x elasticity, suggesting effective go-to-market execution.
Revenue Forecast
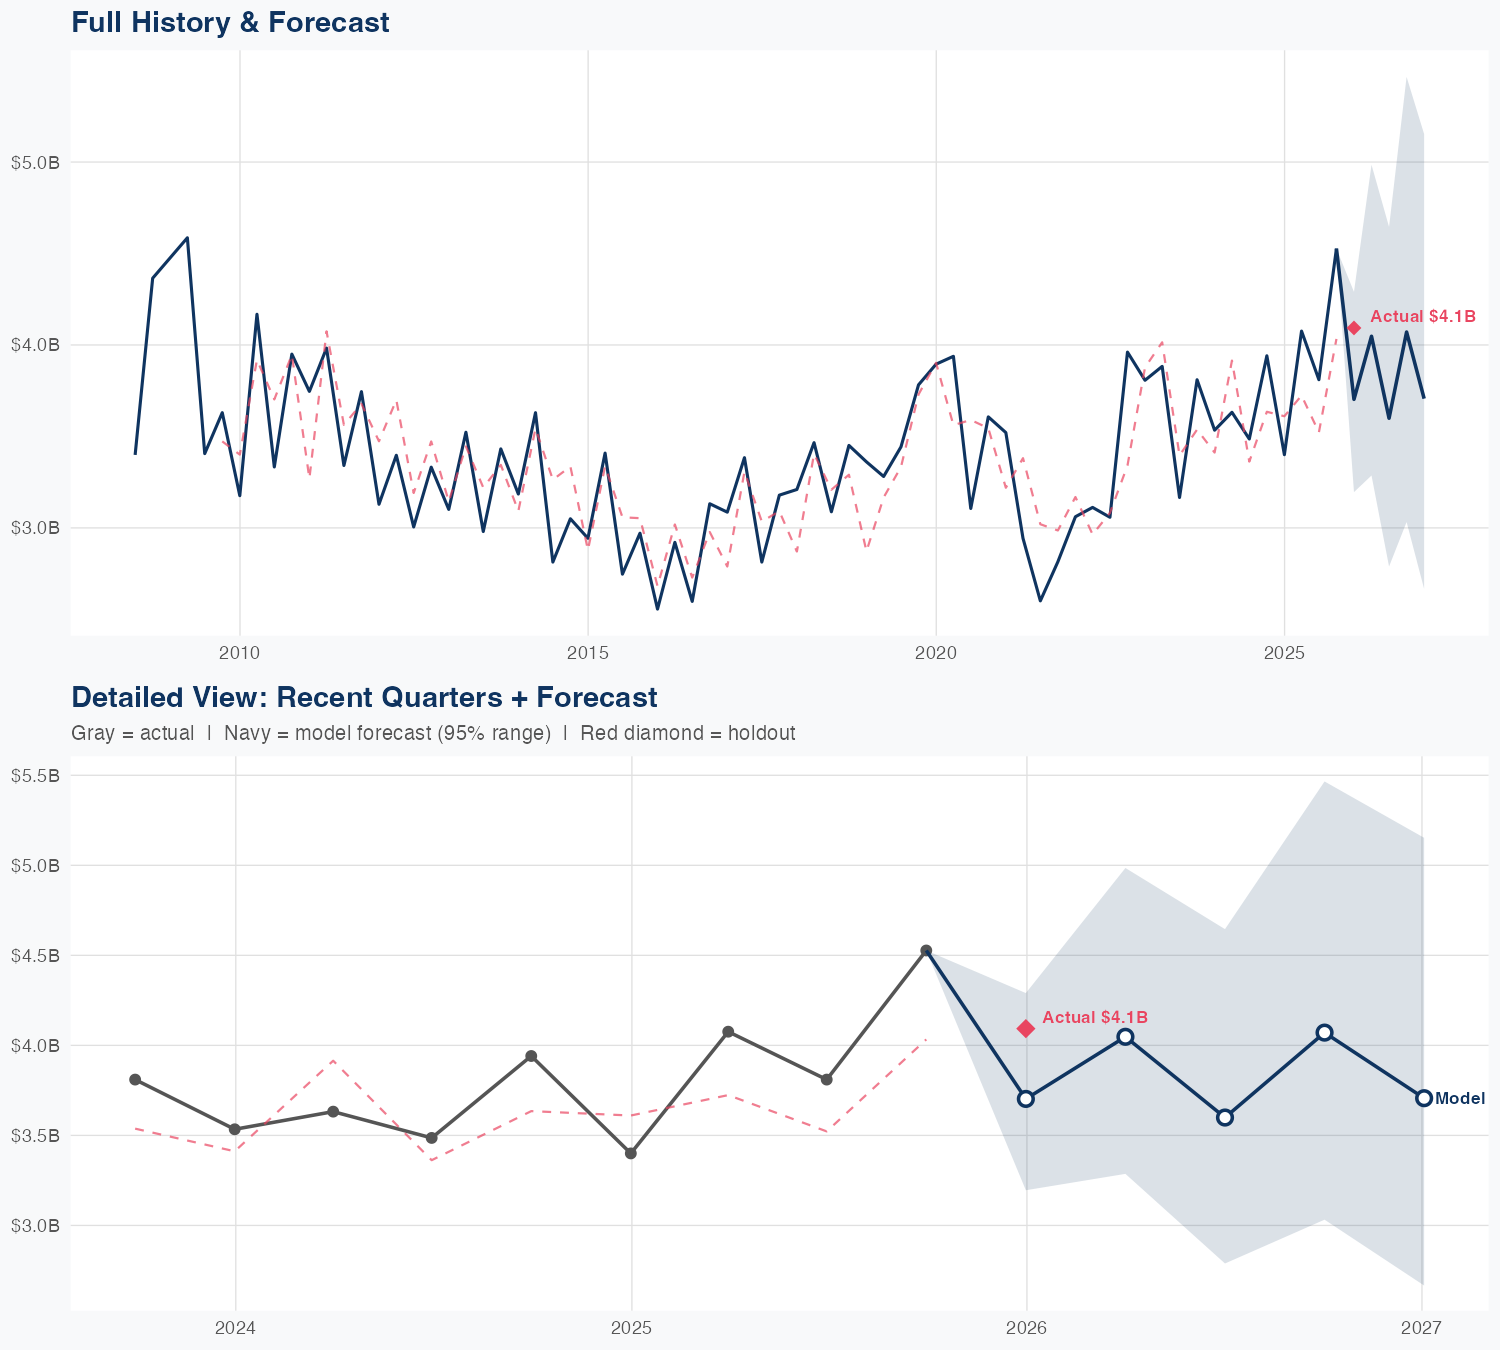
Quarterly Detail
| Quarter | Model Forecast | Actual | 95% Range | YoY Growth | Status |
|---|---|---|---|---|---|
| Q4 2025 | $3.9B | $4.1B | $3.2B – $4.8B | +14.5% | ✓ In range |
| Q2 2026 | $4.0B | $3.2B – $4.9B | -1.8% | ||
| Q3 2026 | $4.1B | $3.3B – $5.1B | +7.4% | ||
| Q4 2026 | $4.0B | $3.2B – $5.0B | -11.3% | ||
| Q1 2027 | $4.0B | $3.2B – $5.0B | -1.8% |
Seasonal Factors
| Fiscal Quarter | Seasonal Factor | vs Trend | Interpretation | Obs. |
|---|---|---|---|---|
| FQ1 (Sep–Nov) | 1.0261 | +2.6% | In line with trend | 17 |
| FQ2 (Dec–Feb) | 1.0225 | +2.2% | In line with trend | 17 |
| FQ3 (Mar–May) | 1.0226 | +2.3% | In line with trend | 16 |
| FQ4 (Jun–Aug) | 0.9377 | -6.2% | -6.2% below trend | 16 |
How Spending Drives Revenue
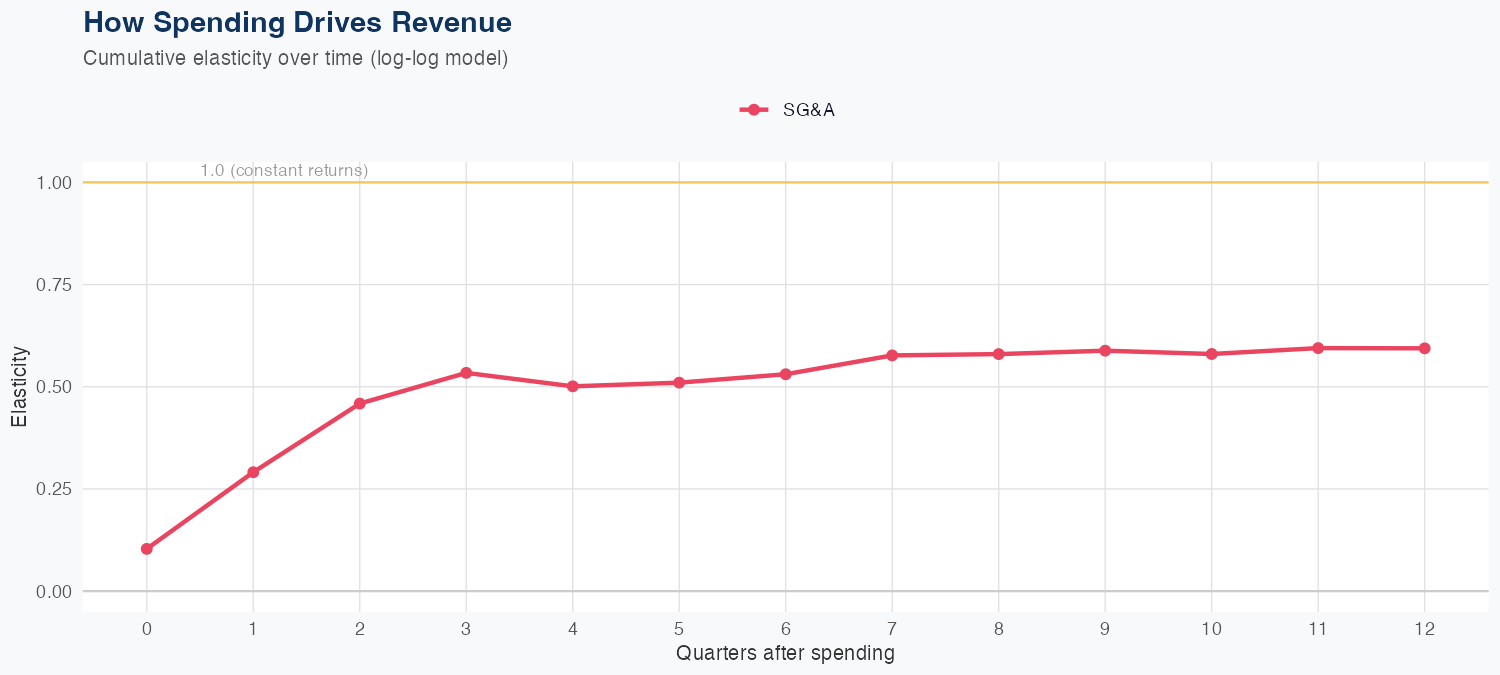
Spending Efficiency Over Time
Current SG&A elasticity: -0.1664x
Want this analysis for your portfolio?
I build custom revenue intelligence reports for investors and companies using SEC filing data, econometric modeling, and AI-powered insights.
Get in Touch