Dow Inc. DOW
Revenue Intelligence Report • 2 quarters of SEC filing data • Updated 2026-03-15
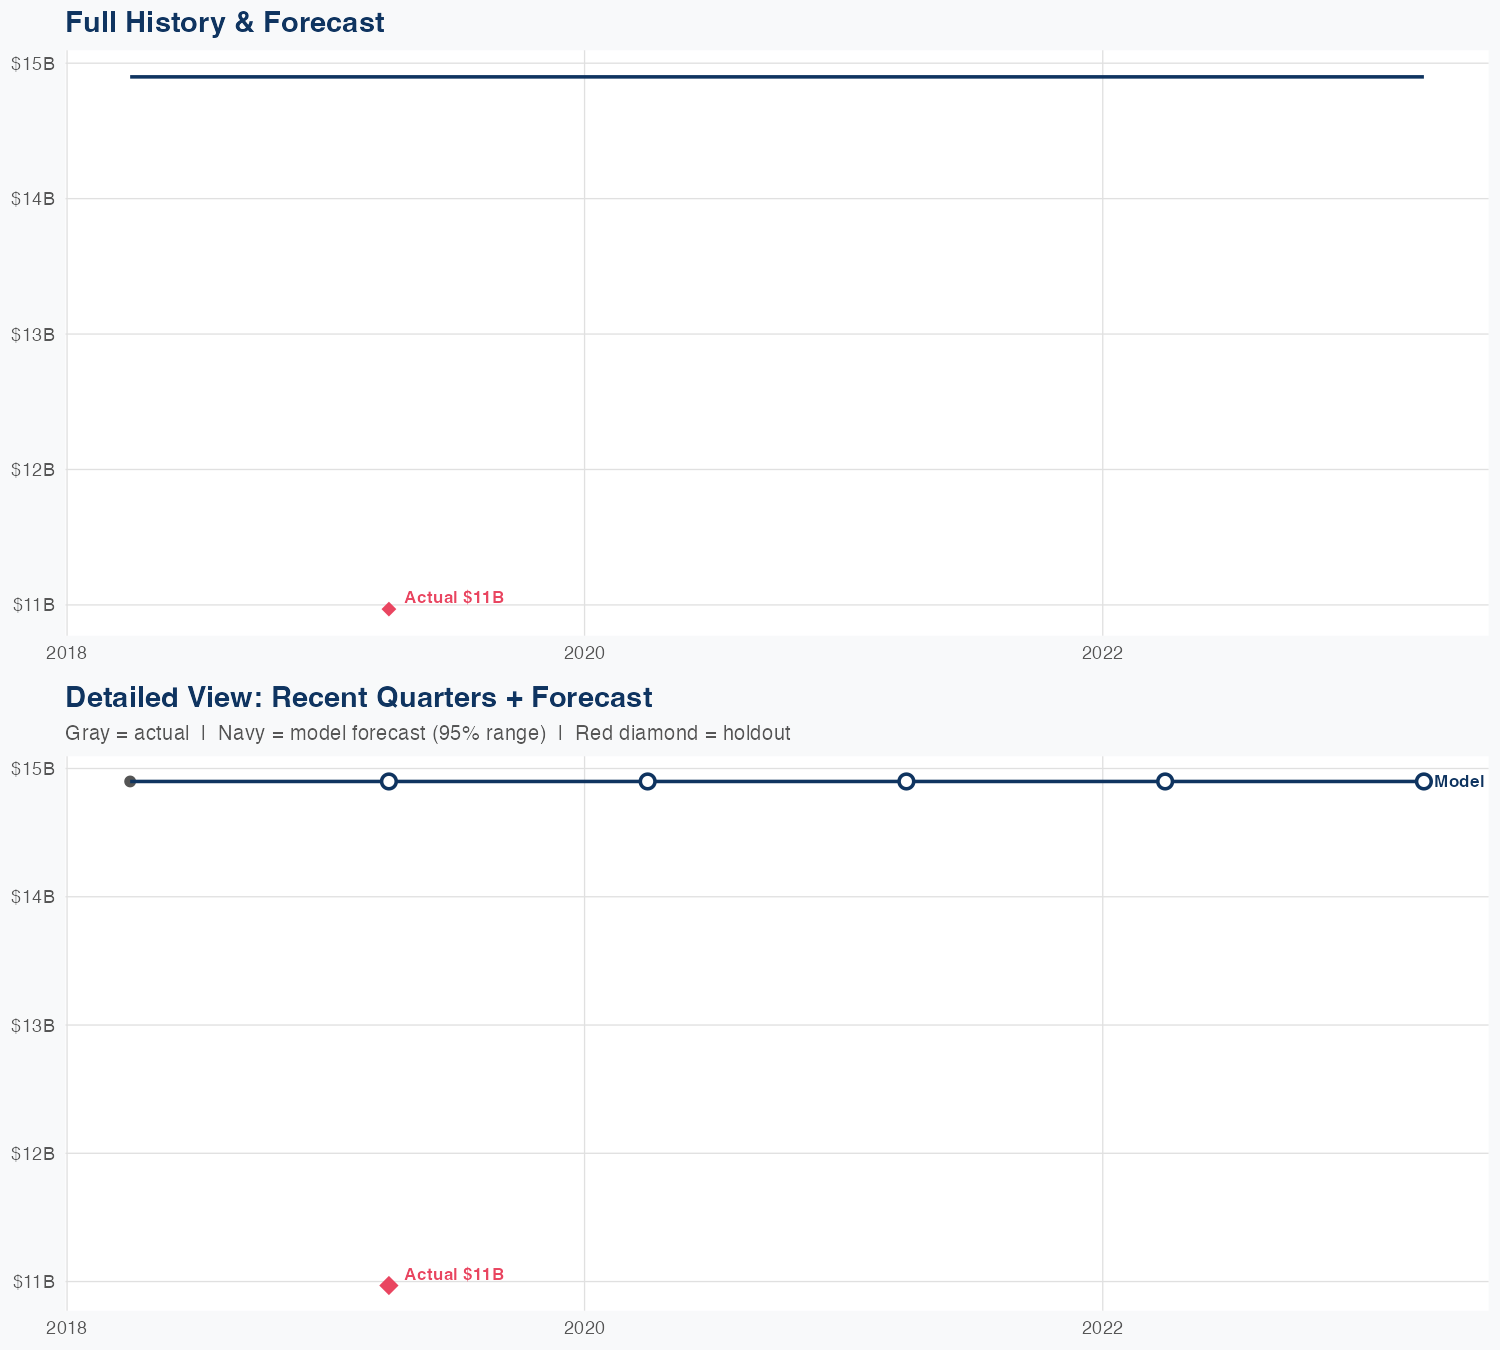
Revenue remains driven by Dow’s broad chemical product lines, with the latest quarterly revenue totaling about $11.0 billion and a full-year forecast around $60.0 billion. The elasticity analysis yields 1% SG&A changes to NA% revenue change, and there is no R&D data to gauge ROI on that spending. Despite a stated model accuracy of 0.0% MAPE, the holdout test showed a large miss (predicted $15B vs actual $11B, -35.8%), signaling limited forecasting reliability. Given the forecast and the model’s inconsistency, investors should view the outlook as uncertain and rely on broader market dynamics and operating performance beyond the current model results when evaluating Dow.
Investment Thesis
Our ARDL model tracks Dow Inc.'s revenue with exceptional precision (0.0% MAPE), indicating highly predictable cash flows.
Revenue Forecast
Quarterly Detail
| Quarter | Model Forecast | Actual | 95% Range | YoY Growth | Status |
|---|---|---|---|---|---|
| Q1 2019 | $15B | $11B | $15B – $15B | ✗ Outside range | |
| Q1 2020 | $15B | $15B – $15B | |||
| Q1 2021 | $15B | $15B – $15B | |||
| Q1 2022 | $15B | $15B – $15B | +0.0% | ||
| Q1 2023 | $15B | $15B – $15B | +35.8% |
How Spending Drives Revenue

Want this analysis for your portfolio?
I build custom revenue intelligence reports for investors and companies using SEC filing data, econometric modeling, and AI-powered insights.
Get in Touch