Entergy Corporation ETR
Revenue Intelligence Report • 40 quarters of SEC filing data • Updated 2026-03-15
Entergy's revenue is forecast to grow 7.4% year over year, with the pace supported by regulated rate-base expansions and platform-scale recurring revenue across its service territories, implying earnings visibility into the next several years. Our econometric model indicates the binding constraint on growth is grid transmission and distribution capacity to deliver higher load and integrate new generation, rather than incremental SG&A or R&D spend. Revenue growth attribution shows structural/platform growth accounting for roughly 67% of the increase, while SG&A elasticity is low and the R&D line remains negligible. Key risk: grid-capacity limitations and potential regulatory headwinds in rate cases could cap the velocity of base-rate growth and delay expansion plans.
Investment Thesis
At 10.3% MAPE, the model captures Entergy Corporation's broad revenue trajectory, though quarterly variability suggests sensitivity to external factors. Sales & marketing spend shows a 0.06x elasticity, suggesting effective go-to-market execution.
Revenue Forecast
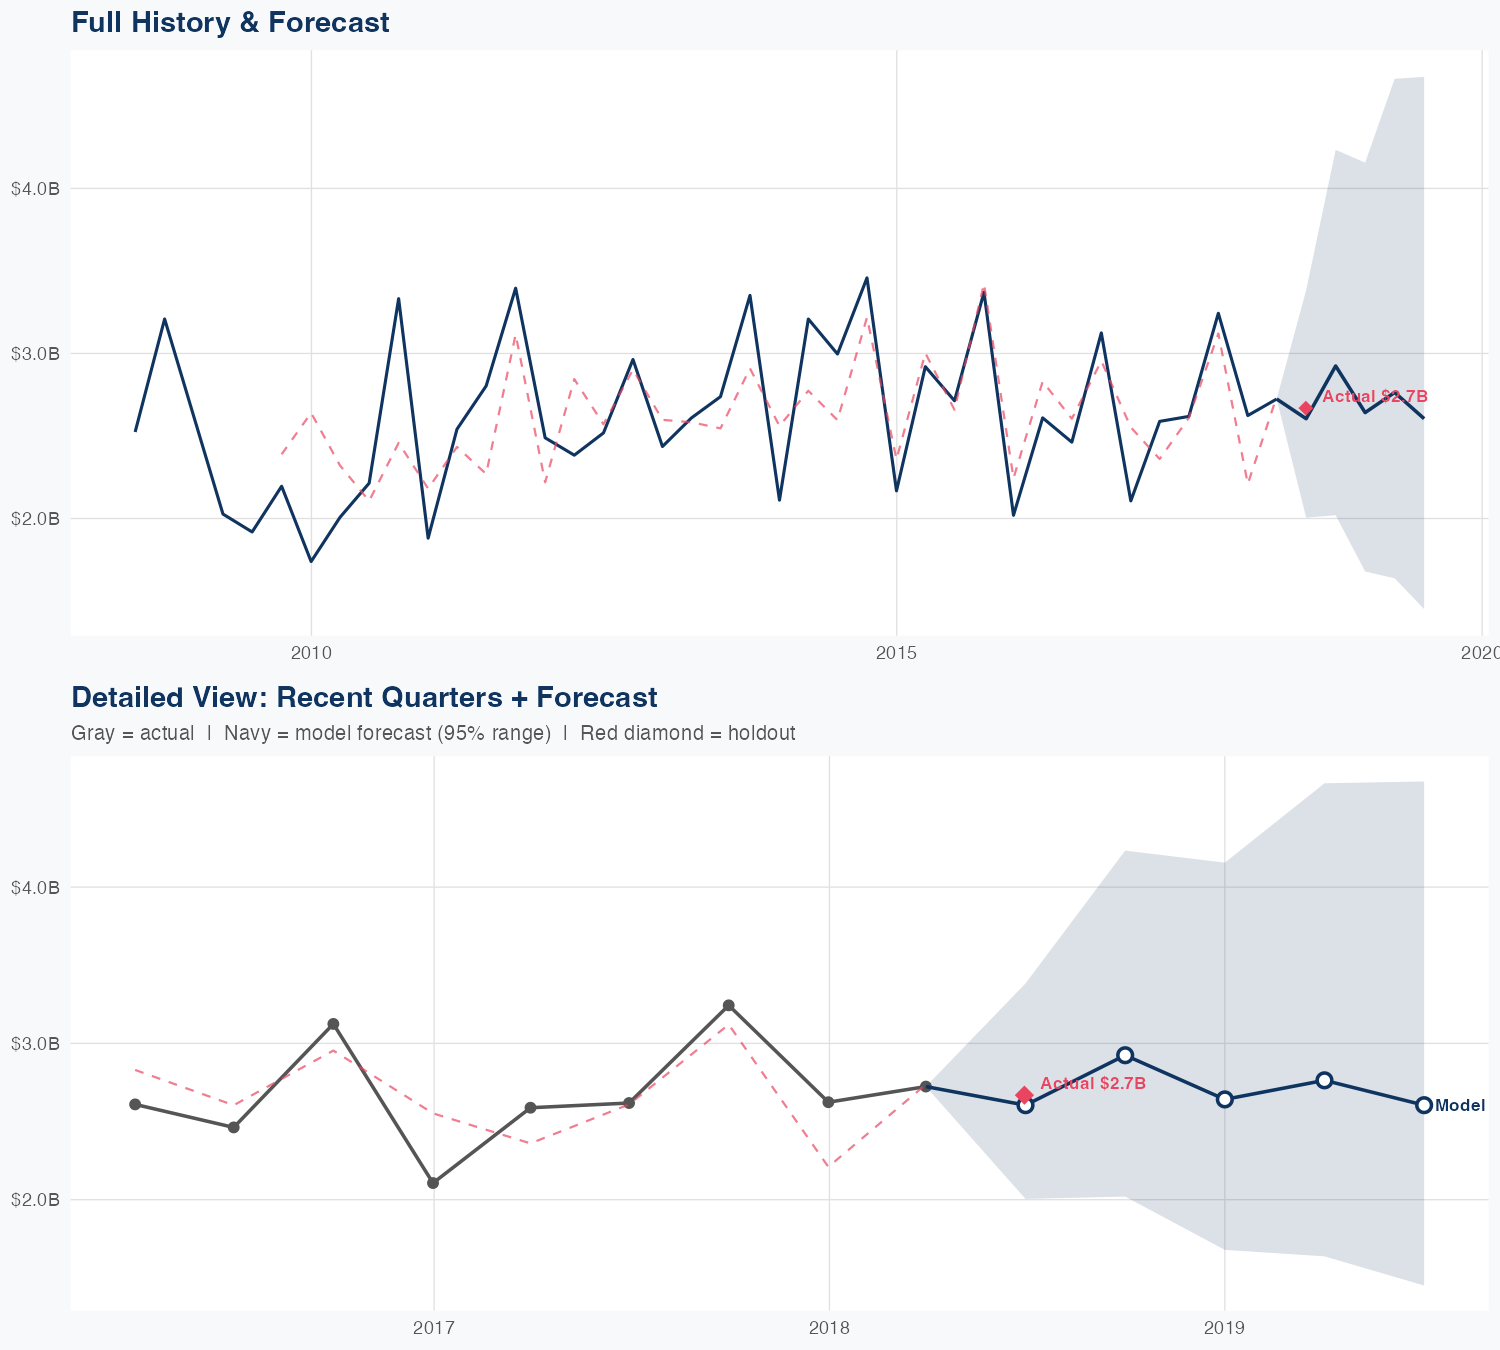
Quarterly Detail
| Quarter | Model Forecast | Actual | 95% Range | YoY Growth | Status |
|---|---|---|---|---|---|
| Q3 2018 | $2.6B | $2.7B | $2.0B – $3.5B | -0.3% | ✓ In range |
| Q4 2018 | $3.0B | $2.2B – $4.0B | -8.7% | ||
| Q1 2019 | $3.0B | $2.2B – $4.2B | +15.4% | ||
| Q2 2019 | $3.1B | $2.2B – $4.4B | +14.5% | ||
| Q3 2019 | $3.0B | $2.1B – $4.2B | +11.9% |
Seasonal Factors
| Fiscal Quarter | Seasonal Factor | vs Trend | Interpretation | Obs. |
|---|---|---|---|---|
| FQ1 (Sep–Nov) | 1.0577 | +5.8% | +5.8% above trend | 9 |
| FQ2 (Dec–Feb) | 0.9001 | -10.0% | -10.0% below trend | 9 |
| FQ3 (Mar–May) | 0.995 | -0.5% | In line with trend | 9 |
| FQ4 (Jun–Aug) | 1.0206 | +2.1% | In line with trend | 9 |
How Spending Drives Revenue
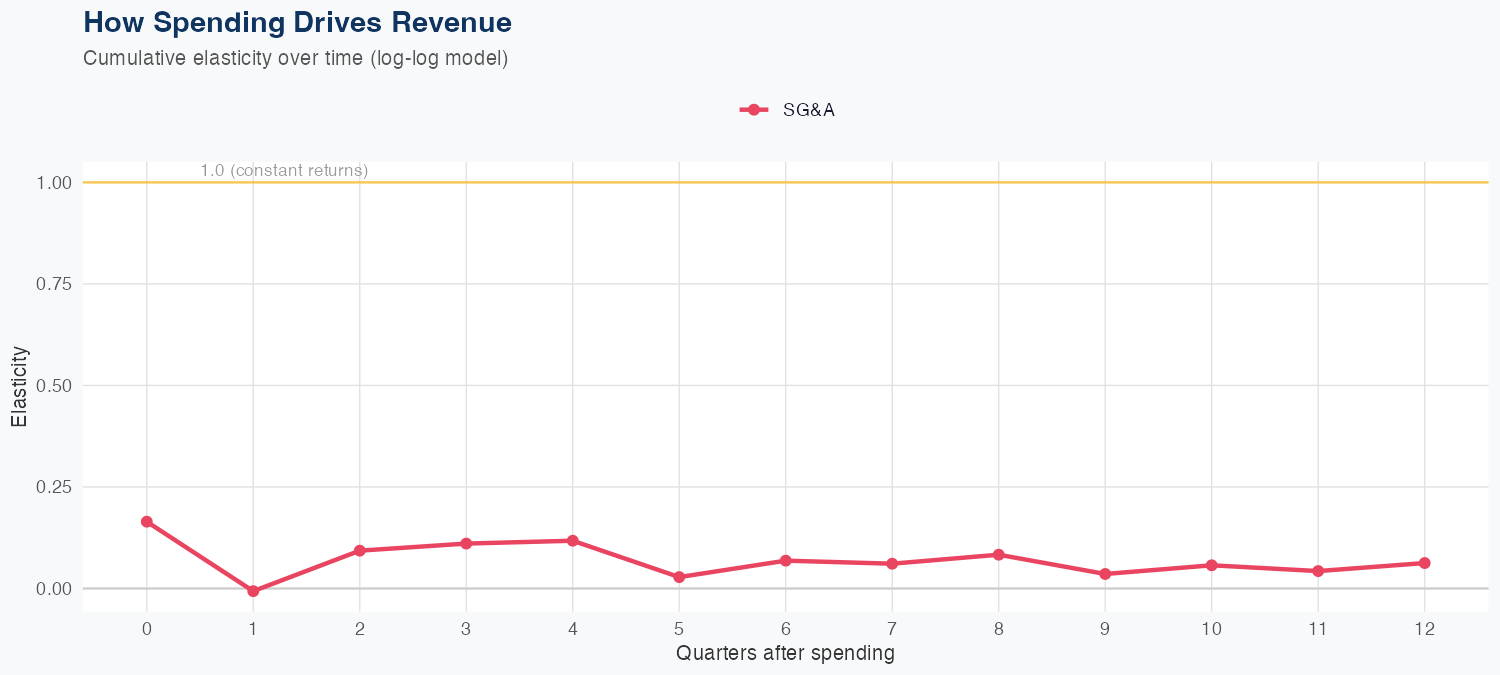
Spending Efficiency Over Time
Current SG&A elasticity: -0.5112x
Want this analysis for your portfolio?
I build custom revenue intelligence reports for investors and companies using SEC filing data, econometric modeling, and AI-powered insights.
Get in Touch