Evergy, Inc. EVRG
Revenue Intelligence Report • 34 quarters of SEC filing data • Updated 2026-03-15
Evergy’s revenue is forecast to be essentially flat for the coming year, down about 0.6% year over year, with a modest structural/platform lift offset by higher SG&A-driven topline activity. The binding constraint on growth is regulatory capex approvals and rate-case cadence—Evergy can only grow revenue as regulators authorize grid investments and allow corresponding rate recovery. In our econometric model, roughly 19% of growth comes from structural/platform expansion and about 81% from SG&A spending, with the SG&A impact strengthening as the spend becomes more productive. Time-varying analysis shows the SG&A multiplier has risen, indicating incremental SG&A spend now yields more topline per dollar. Key risk is regulatory timing and outcomes for capex approvals, which could cap revenue growth even if spending accelerates.
Investment Thesis
The econometric model achieves strong accuracy (3.7% MAPE), suggesting Evergy, Inc.'s revenue trajectory is well-characterized by its spending patterns. Each $1 of SG&A spending generates $1.25 in revenue, reflecting strong commercial efficiency.
Revenue Forecast
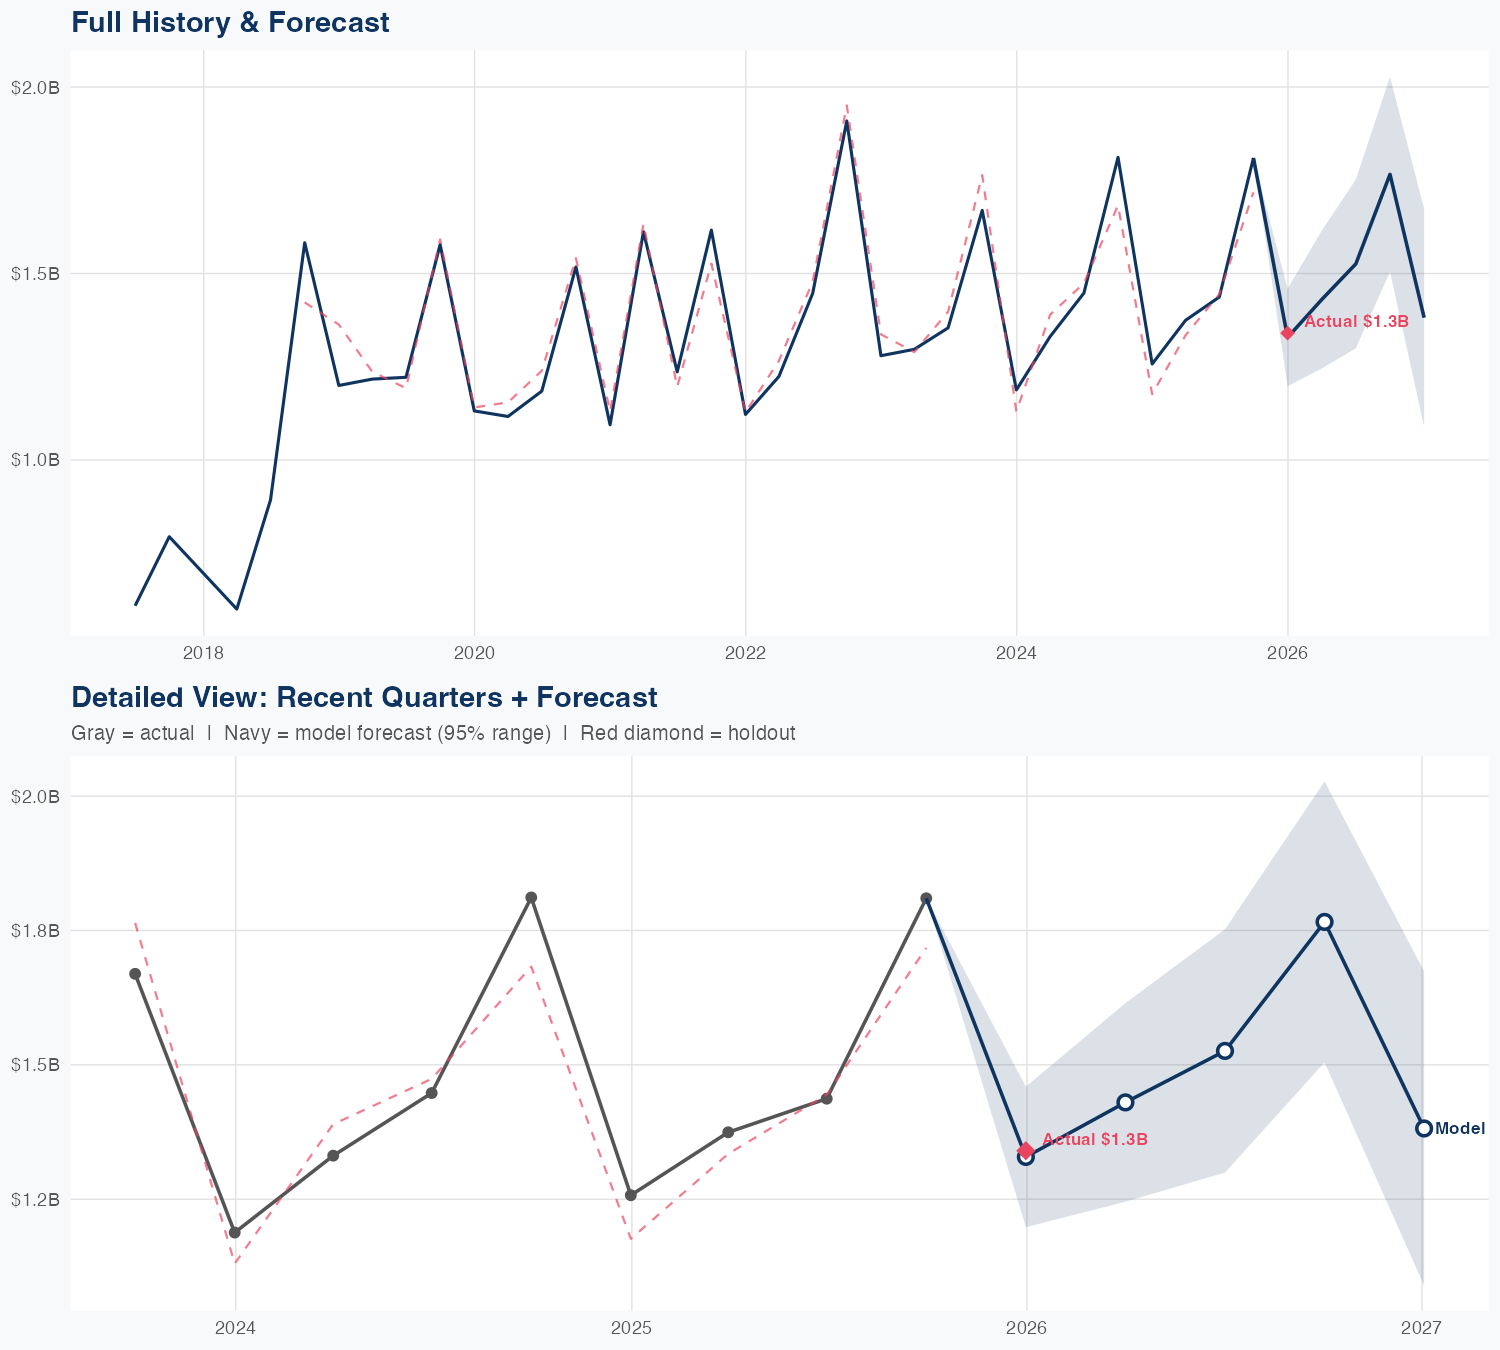
Quarterly Detail
| Quarter | Model Forecast | Actual | 95% Range | YoY Growth | Status |
|---|---|---|---|---|---|
| Q4 2025 | $1.5B | $1.3B | $1.2B – $1.8B | +15.8% | ✓ In range |
| Q2 2026 | $1.4B | $1.1B – $1.8B | +3.4% | ||
| Q3 2026 | $1.4B | $1.2B – $1.8B | +0.6% | ||
| Q4 2026 | $1.6B | $1.3B – $2.0B | -12.1% | ||
| Q1 2027 | $1.5B | $1.2B – $1.8B | +9.4% |
Seasonal Factors
| Fiscal Quarter | Seasonal Factor | vs Trend | Interpretation | Obs. |
|---|---|---|---|---|
| FQ1 (Sep–Nov) | 1.0537 | +5.4% | +5.4% above trend | 8 |
| FQ2 (Dec–Feb) | 0.9949 | -0.5% | In line with trend | 8 |
| FQ3 (Mar–May) | 0.984 | -1.6% | In line with trend | 7 |
| FQ4 (Jun–Aug) | 0.9821 | -1.8% | In line with trend | 7 |
How Spending Drives Revenue
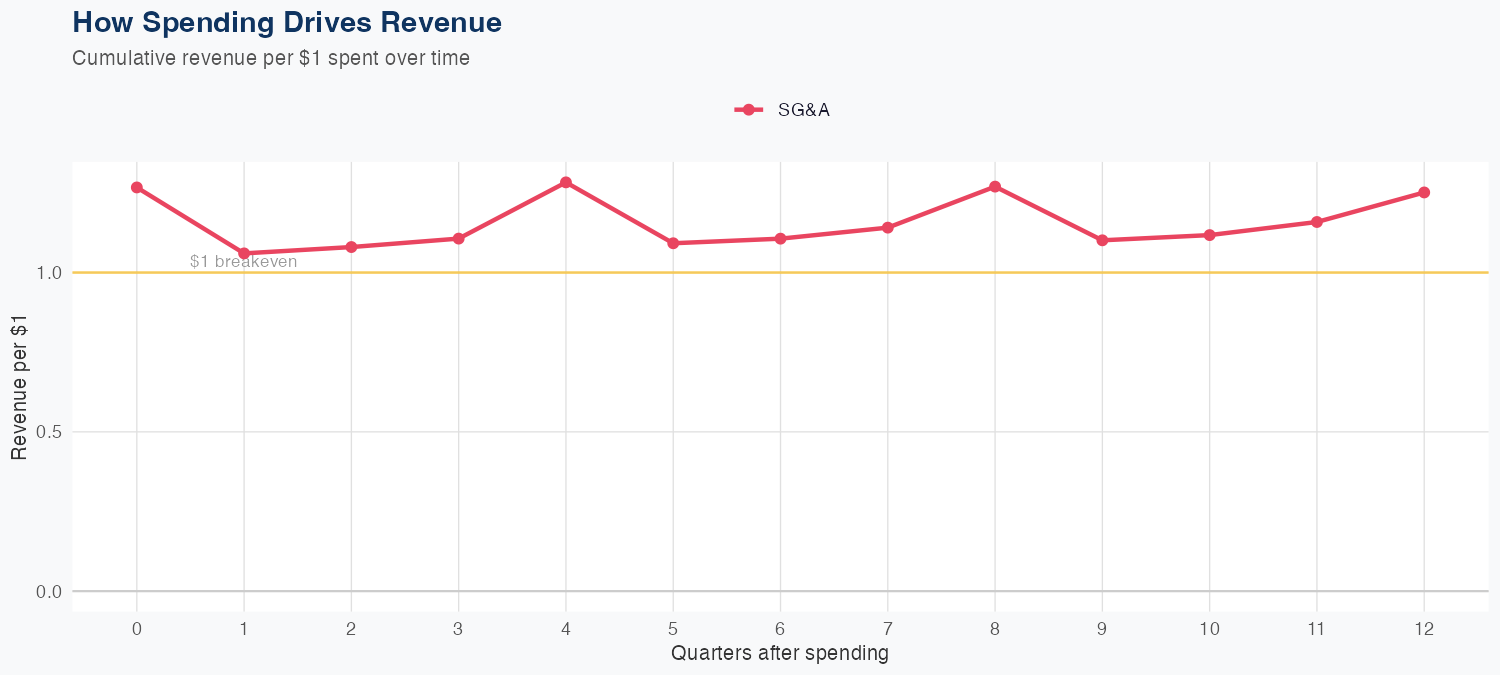
Spending Efficiency Over Time
Current SG&A multiplier: 1.759
Want this analysis for your portfolio?
I build custom revenue intelligence reports for investors and companies using SEC filing data, econometric modeling, and AI-powered insights.
Get in Touch