Expeditors International of Washington, Inc. EXPD
Revenue Intelligence Report • 70 quarters of SEC filing data • Updated 2026-03-15
Revenue is forecast to rise about 24% year over year, lifting FY revenue from $13.7 billion to roughly $17.0 billion as demand for Expeditors’ global logistics solutions remains robust. Our econometric model shows the binding constraint on growth is delivery capacity in Expeditors’ logistics network—the carrier capacity, staffing, and facilities needed to scale higher volumes. Current growth attribution is heavily SG&A-driven (about 97% of the lift) with structural/platform growth at 3% and R&D contributing essentially nothing. Key risk is a capacity constraint: if the network cannot scale with SG&A investment, volume growth may underperform and margin upside could be limited, especially in the face of possible freight-market volatility or regulatory shifts.
Investment Thesis
The econometric model achieves strong accuracy (4.9% MAPE), suggesting Expeditors International of Washington, Inc.'s revenue trajectory is well-characterized by its spending patterns. Sales & marketing spend shows a 1.16x elasticity, suggesting effective go-to-market execution.
Revenue Forecast
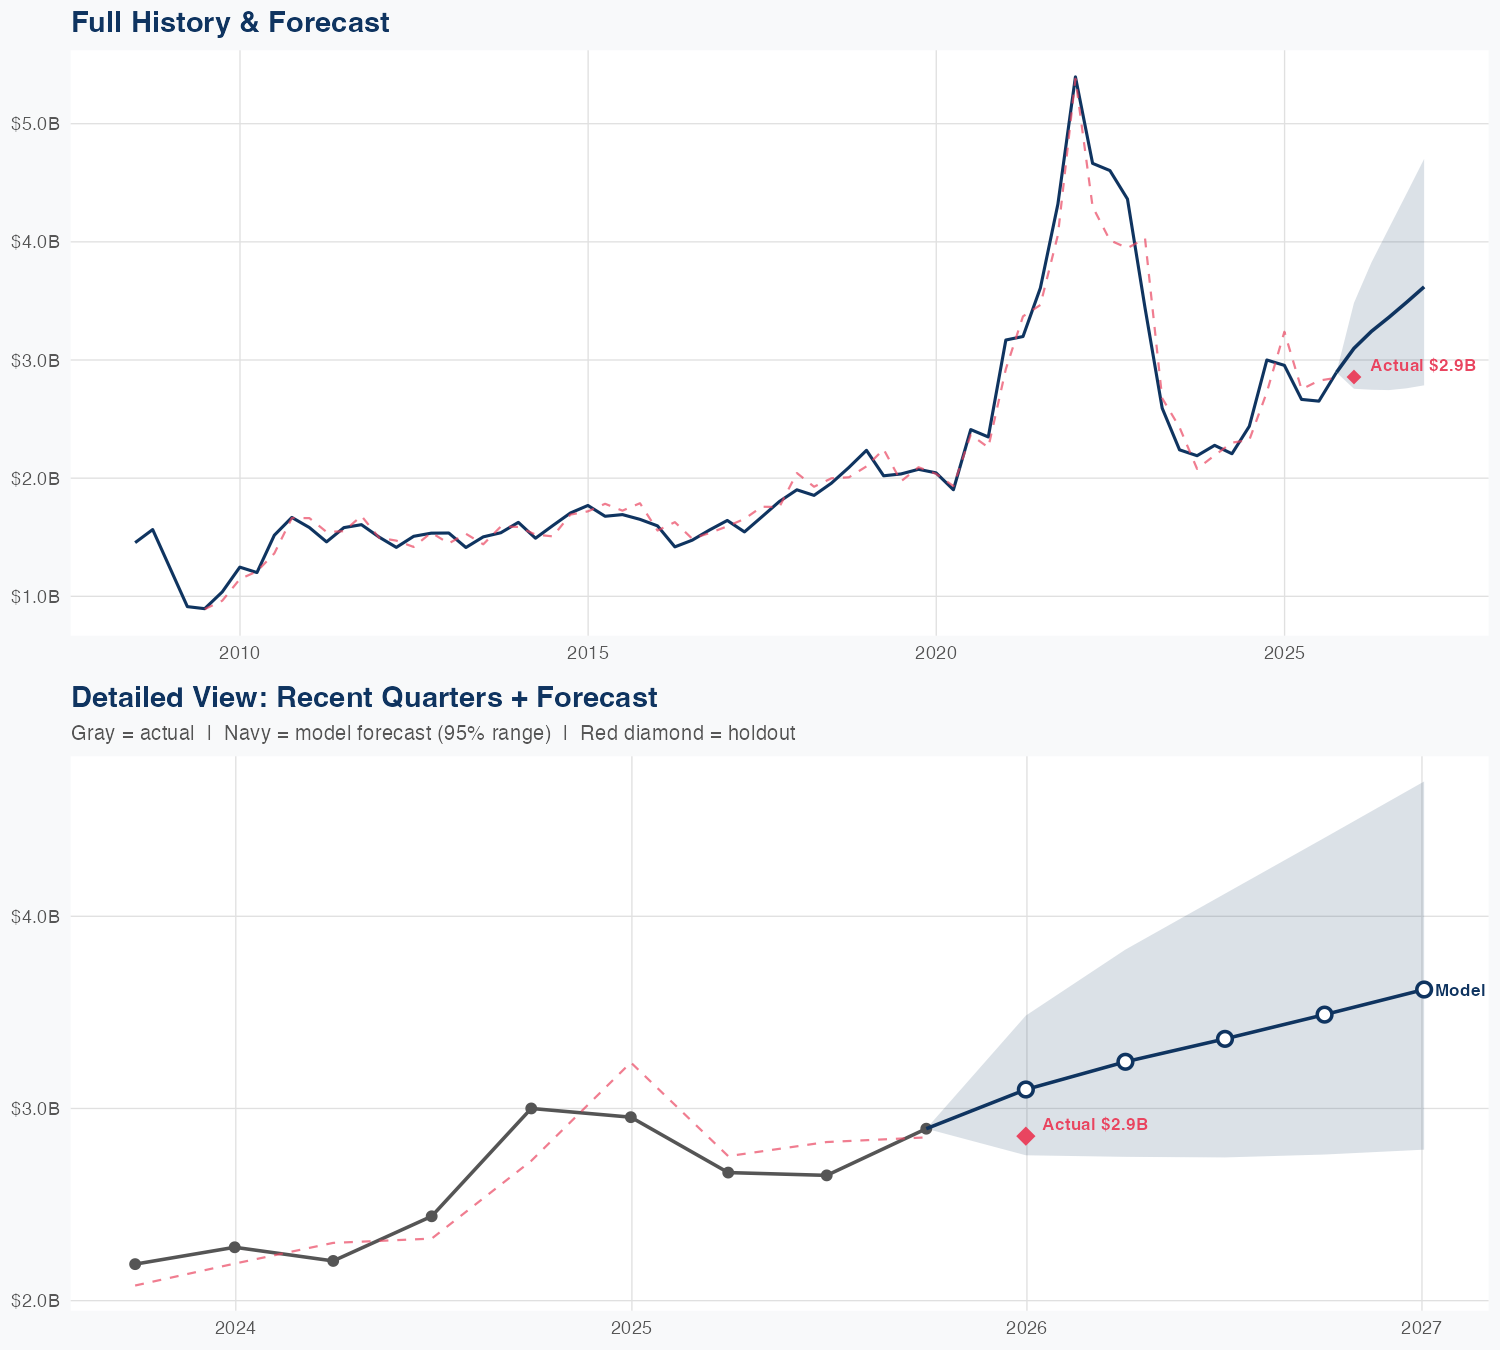
Quarterly Detail
| Quarter | Model Forecast | Actual | 95% Range | YoY Growth | Status |
|---|---|---|---|---|---|
| Q4 2025 | $3.0B | $2.9B | $2.6B – $3.5B | +2.3% | ✓ In range |
| Q2 2026 | $3.2B | $2.7B – $3.7B | +18.9% | ||
| Q3 2026 | $3.3B | $2.9B – $3.9B | +25.8% | ||
| Q4 2026 | $3.6B | $3.1B – $4.2B | +24.3% | ||
| Q1 2027 | $3.6B | $3.1B – $4.3B | +27.5% |
Seasonal Factors
| Fiscal Quarter | Seasonal Factor | vs Trend | Interpretation | Obs. |
|---|---|---|---|---|
| FQ1 (Sep–Nov) | 1.0172 | +1.7% | In line with trend | 17 |
| FQ2 (Dec–Feb) | 1.0243 | +2.4% | In line with trend | 17 |
| FQ3 (Mar–May) | 0.9612 | -3.9% | -3.9% below trend | 16 |
| FQ4 (Jun–Aug) | 1.0194 | +1.9% | In line with trend | 17 |
How Spending Drives Revenue
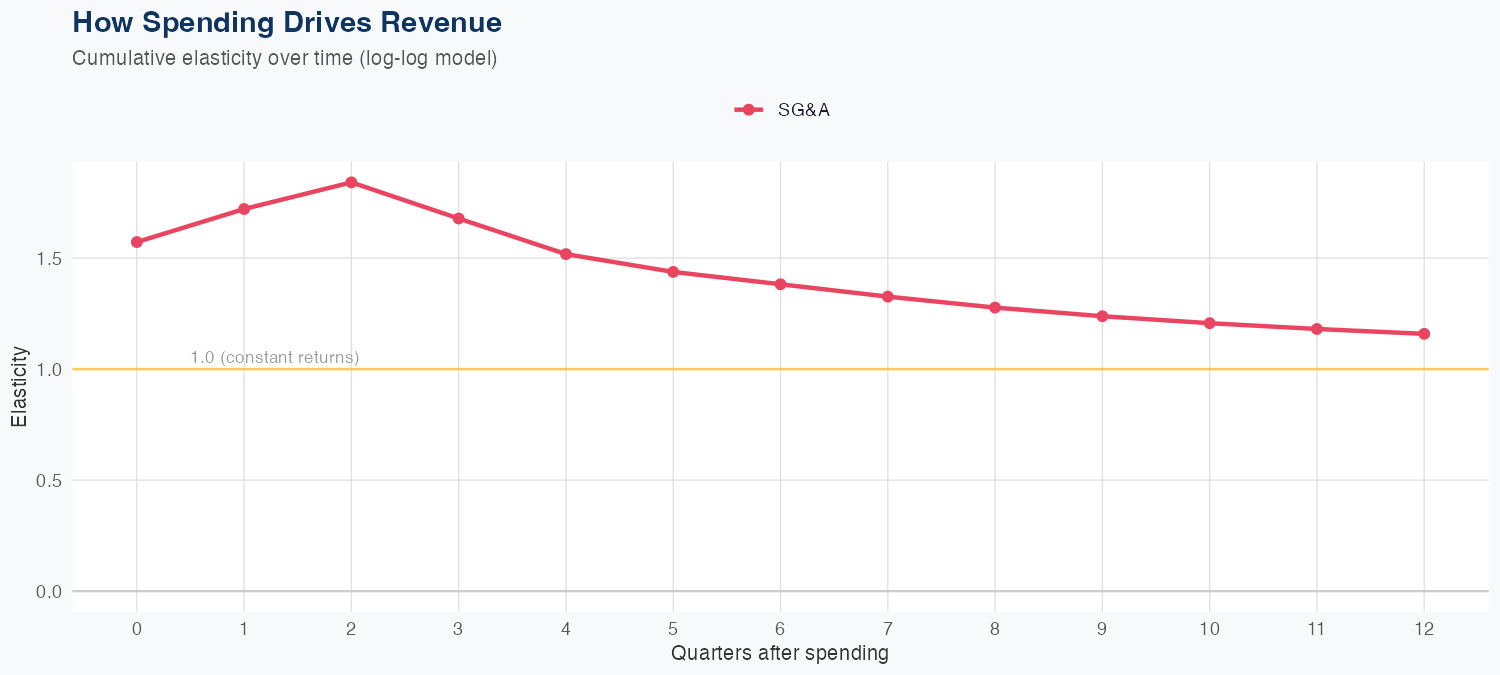
Spending Efficiency Over Time
Current SG&A elasticity: 2.2609x
Want this analysis for your portfolio?
I build custom revenue intelligence reports for investors and companies using SEC filing data, econometric modeling, and AI-powered insights.
Get in Touch