Flutter Entertainment Plc FLUT
Revenue Intelligence Report • 12 quarters of SEC filing data • Updated 2026-03-15
Flutter's revenue is expected to rise about 30% year over year to roughly $27.6 billion, with growth led by platform-scale operations and ongoing, selective investments in SG&A and product development. Our econometric model attributes about 12% of the lift to structural/platform growth, with SG&A contributing about 51% and R&D about 36% of incremental growth; SG&A leverage has strengthened, implying the business is increasingly driving revenue beyond marginal spend. The binding constraint on faster expansion appears to be regulatory licensing and market access in key jurisdictions, where backlog and approval timelines cap Flutter’s ability to scale into new markets even as its platform grows. Key risk: a slower-than-expected regulatory pace or policy change that delays licenses could cap upside and press margins.
Investment Thesis
Our ARDL model tracks Flutter Entertainment Plc's revenue with exceptional precision (0.7% MAPE), indicating highly predictable cash flows. Each $1 of SG&A spending generates $5493.42 in revenue, reflecting strong commercial efficiency.
Revenue Forecast
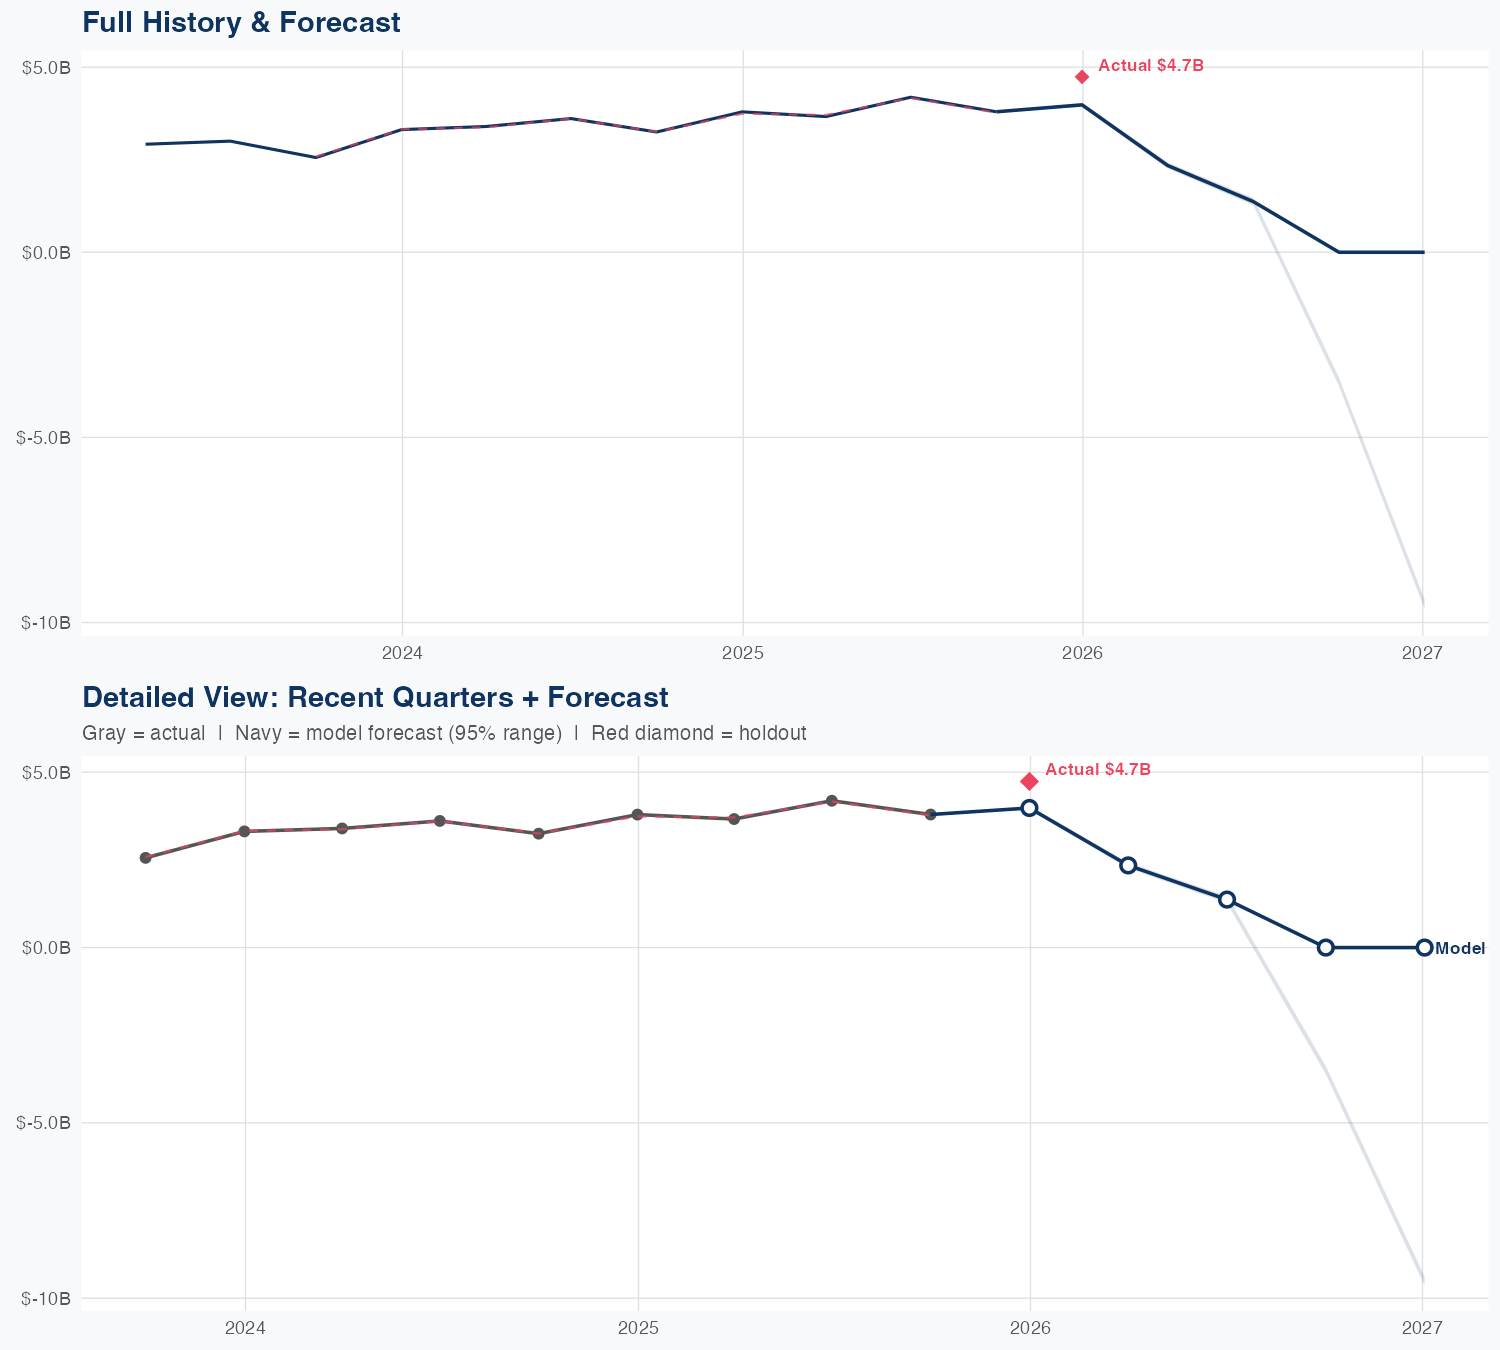
Quarterly Detail
| Quarter | Model Forecast | Actual | 95% Range | YoY Growth | Status |
|---|---|---|---|---|---|
| Q4 2025 | $4.4B | $4.7B | $3.7B – $5.4B | +17.1% | ✓ In range |
| Q2 2026 | $5.0B | $3.8B – $6.5B | +35.8% | ||
| Q3 2026 | $5.3B | $3.5B – $7.9B | +26.1% | ||
| Q4 2026 | $5.3B | $3.8B – $7.5B | +39.6% | ||
| Q1 2027 | $5.7B | $4.3B – $7.6B | +20.3% |
Seasonal Factors
| Fiscal Quarter | Seasonal Factor | vs Trend | Interpretation | Obs. |
|---|---|---|---|---|
| FQ1 (Sep–Nov) | 0.9983 | -0.2% | In line with trend | 3 |
| FQ2 (Dec–Feb) | 0.9969 | -0.3% | In line with trend | 3 |
| FQ3 (Mar–May) | 1.0068 | +0.7% | In line with trend | 2 |
| FQ4 (Jun–Aug) | 1.0051 | +0.5% | In line with trend | 2 |
How Spending Drives Revenue
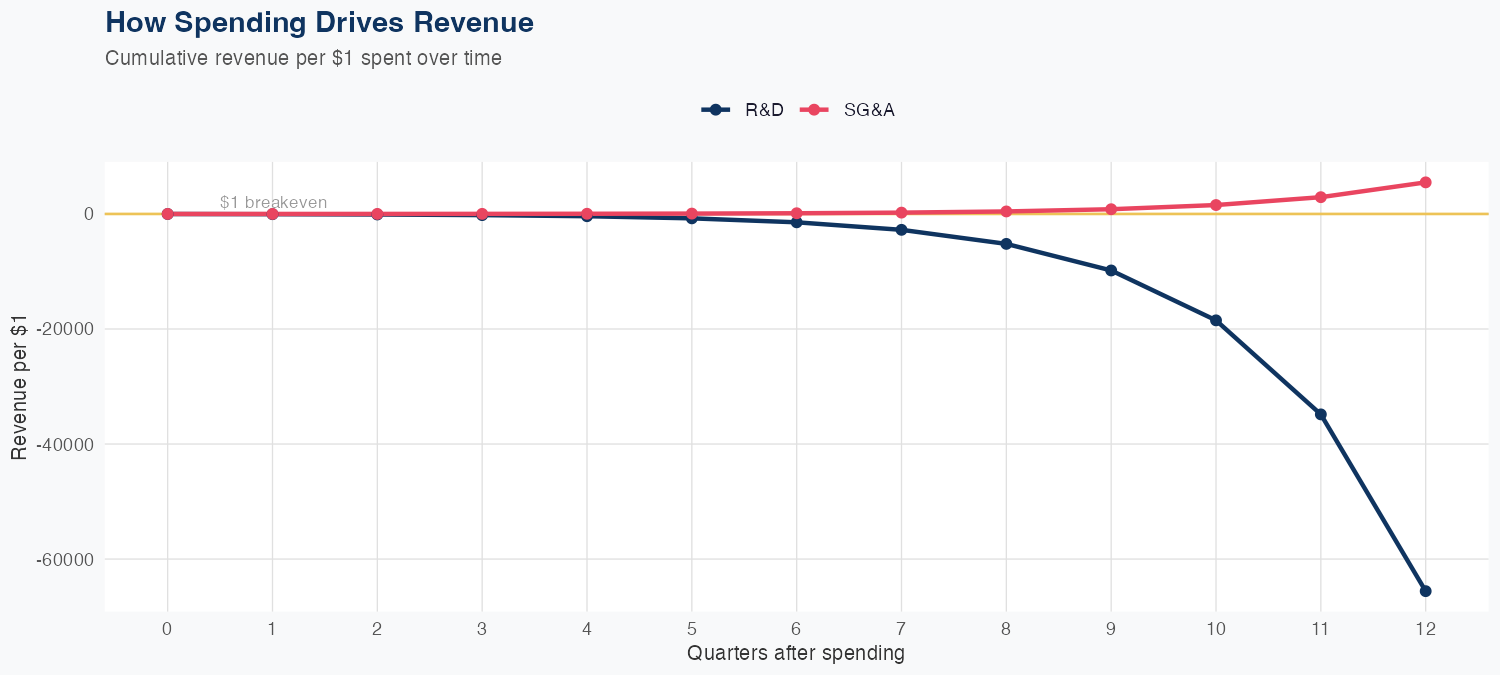
Spending Efficiency Over Time
Current SG&A multiplier: -0.189 • R&D: -0.1463
Want this analysis for your portfolio?
I build custom revenue intelligence reports for investors and companies using SEC filing data, econometric modeling, and AI-powered insights.
Get in Touch