Goldman Sachs Group Inc GS
Revenue Intelligence Report • 55 quarters of SEC filing data • Updated 2026-03-15
Revenue outlook: Goldman Sachs is forecast to grow revenue about 5.5% this year to roughly $14.3 billion, with momentum coming from both platform-scale/structural growth and SG&A-driven expansion. Our econometric model attributes about 49% of the growth to structural/platform drivers and 51% to SG&A spending, with time-varying elasticity implying rising operating leverage and a greater contribution from recurring/scale effects than from incremental spend. Binding constraint: deal flow and execution capacity in the investment banking and markets franchise—i.e., the pipeline and backlog to absorb additional advisory and underwriting activity. Key risk: a cyclical slowdown in capital markets activity or tighter regulation that reduces deal flow and pricing power.
Investment Thesis
At 13.8% MAPE, the model captures Goldman Sachs Group Inc's broad revenue trajectory, though quarterly variability suggests sensitivity to external factors. Sales & marketing spend shows a 2.47x elasticity, suggesting effective go-to-market execution.
Revenue Forecast
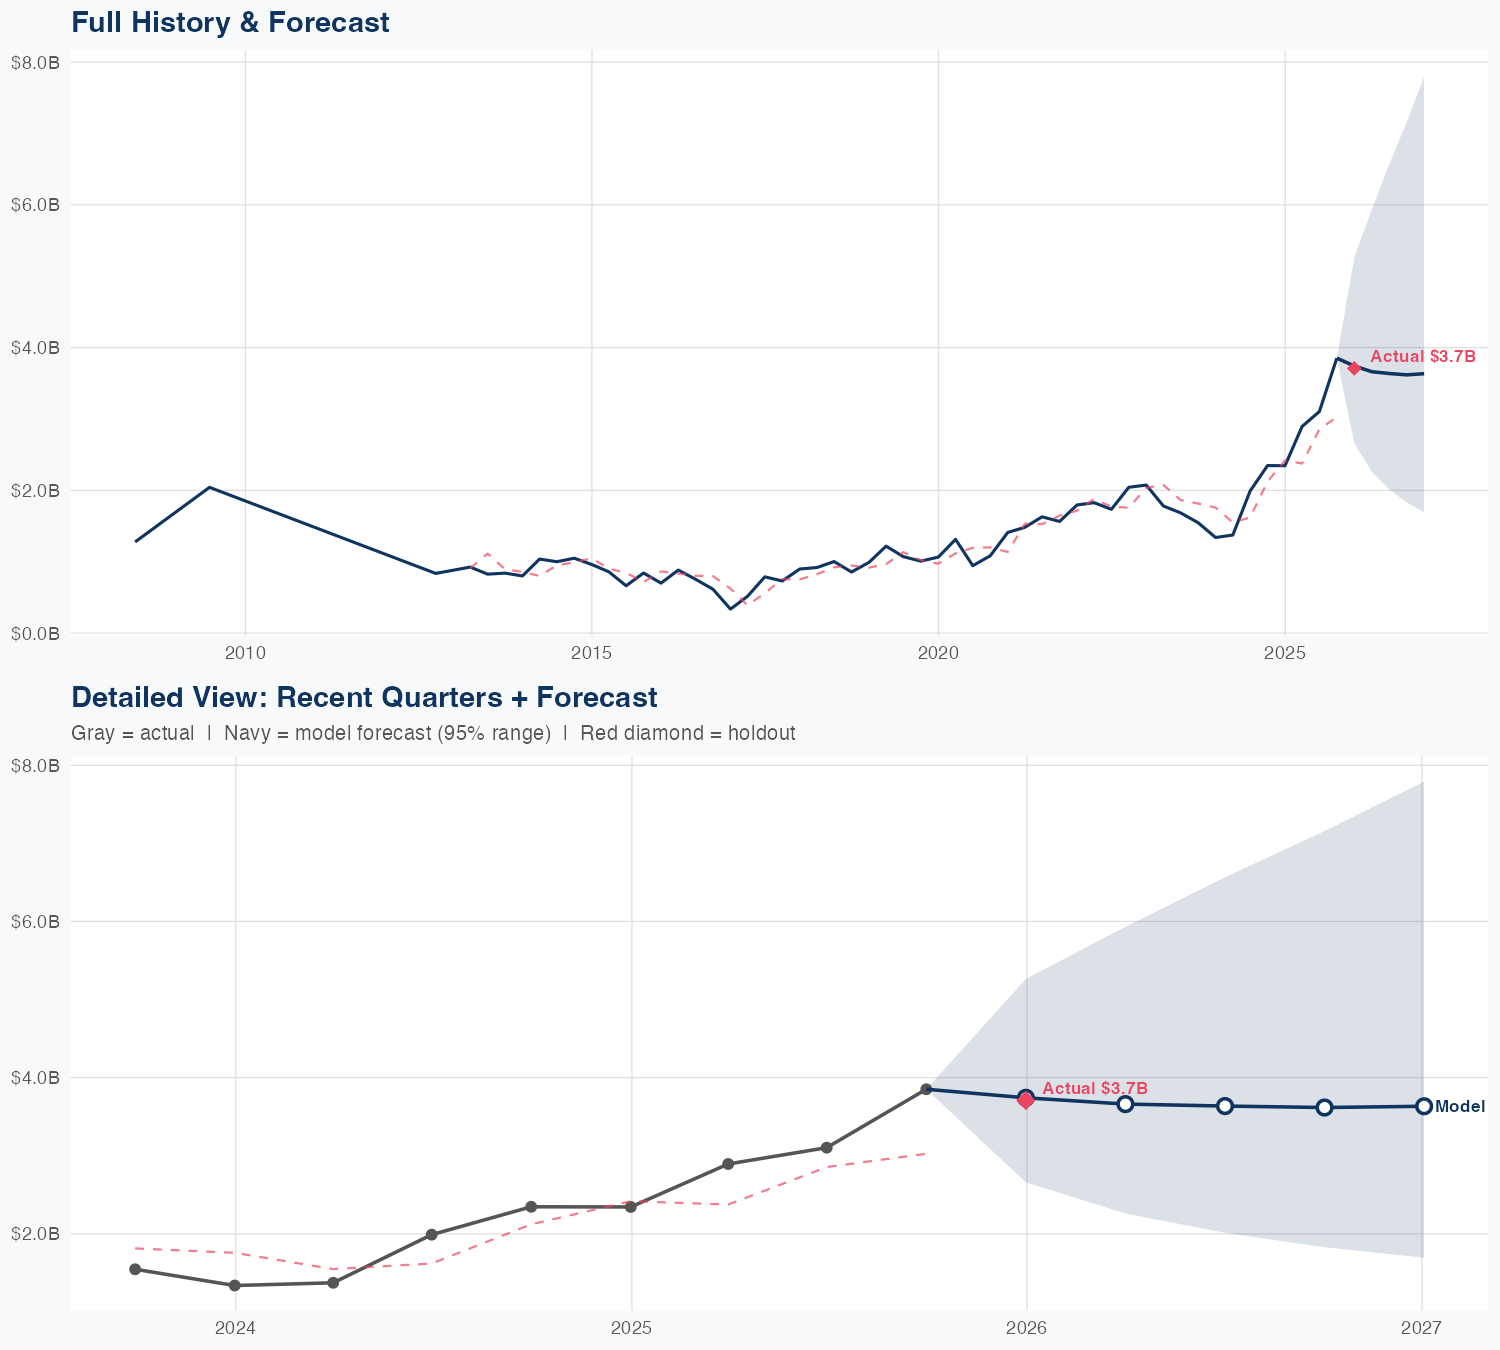
Quarterly Detail
| Quarter | Model Forecast | Actual | 95% Range | YoY Growth | Status |
|---|---|---|---|---|---|
| Q4 2025 | $3.8B | $3.7B | $2.7B – $5.3B | +60.6% | ✓ In range |
| Q2 2026 | $3.6B | $2.2B – $5.8B | +24.6% | ||
| Q3 2026 | $3.6B | $2.0B – $6.5B | +15.9% | ||
| Q4 2026 | $3.5B | $1.8B – $7.0B | -8.7% | ||
| Q1 2027 | $3.6B | $1.7B – $7.7B | -3.2% |
Seasonal Factors
| Fiscal Quarter | Seasonal Factor | vs Trend | Interpretation | Obs. |
|---|---|---|---|---|
| FQ1 (Sep–Nov) | 0.9668 | -3.3% | -3.3% below trend | 13 |
| FQ2 (Dec–Feb) | 0.9942 | -0.6% | In line with trend | 13 |
| FQ3 (Mar–May) | 1.0583 | +5.8% | +5.8% above trend | 13 |
| FQ4 (Jun–Aug) | 0.9788 | -2.1% | In line with trend | 13 |
How Spending Drives Revenue
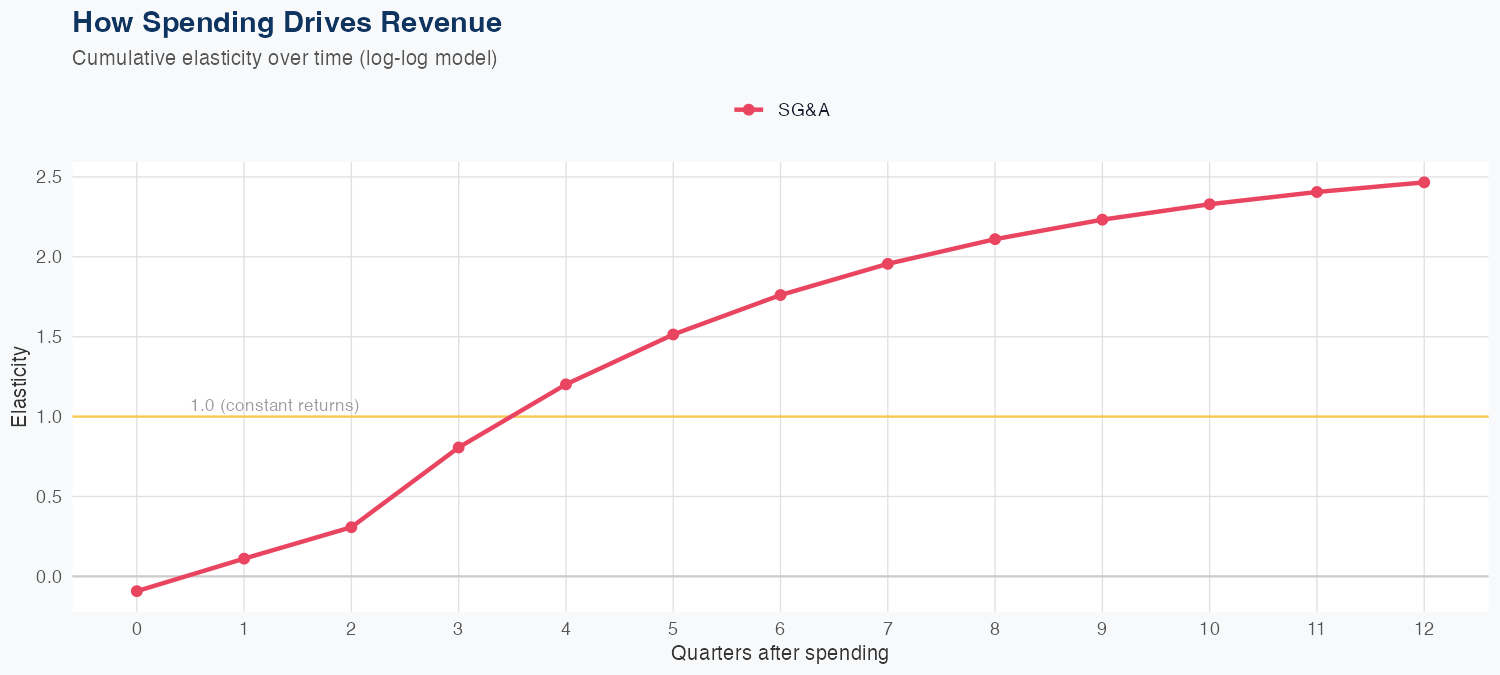
Spending Efficiency Over Time
Current SG&A elasticity: -0.9172x
Want this analysis for your portfolio?
I build custom revenue intelligence reports for investors and companies using SEC filing data, econometric modeling, and AI-powered insights.
Get in Touch