Huntington Bancshares Incorporated HBAN
Revenue Intelligence Report • 66 quarters of SEC filing data • Updated 2026-03-15
HBAN’s revenue is forecast to grow about 3.5% year over year to roughly $1.60 billion, with the advance driven largely by platform-scale and recurring revenue rather than incremental SG&A spending. Our econometric model indicates the binding constraint on revenue growth is loan origination capacity—credit demand and the bank’s ability to deploy capital—rather than internal expense levers. Elasticities show SG&A is a minor lever (about 0.04x per 1% SG&A), and revenue growth attribution points to roughly 70% from structural/platform growth and 30% from SG&A, with R&D essentially negligible. Time-varying analysis confirms SG&A elasticity has declined over time, signaling improving operating leverage as the franchise scales. Key risk: a softer-than-expected loan demand or higher credit costs could cap revenue growth and offset the expected operating leverage.
Investment Thesis
At 8.9% MAPE, the model captures Huntington Bancshares Incorporated's broad revenue trajectory, though quarterly variability suggests sensitivity to external factors. Sales & marketing spend shows a 0.04x elasticity, suggesting effective go-to-market execution.
Revenue Forecast
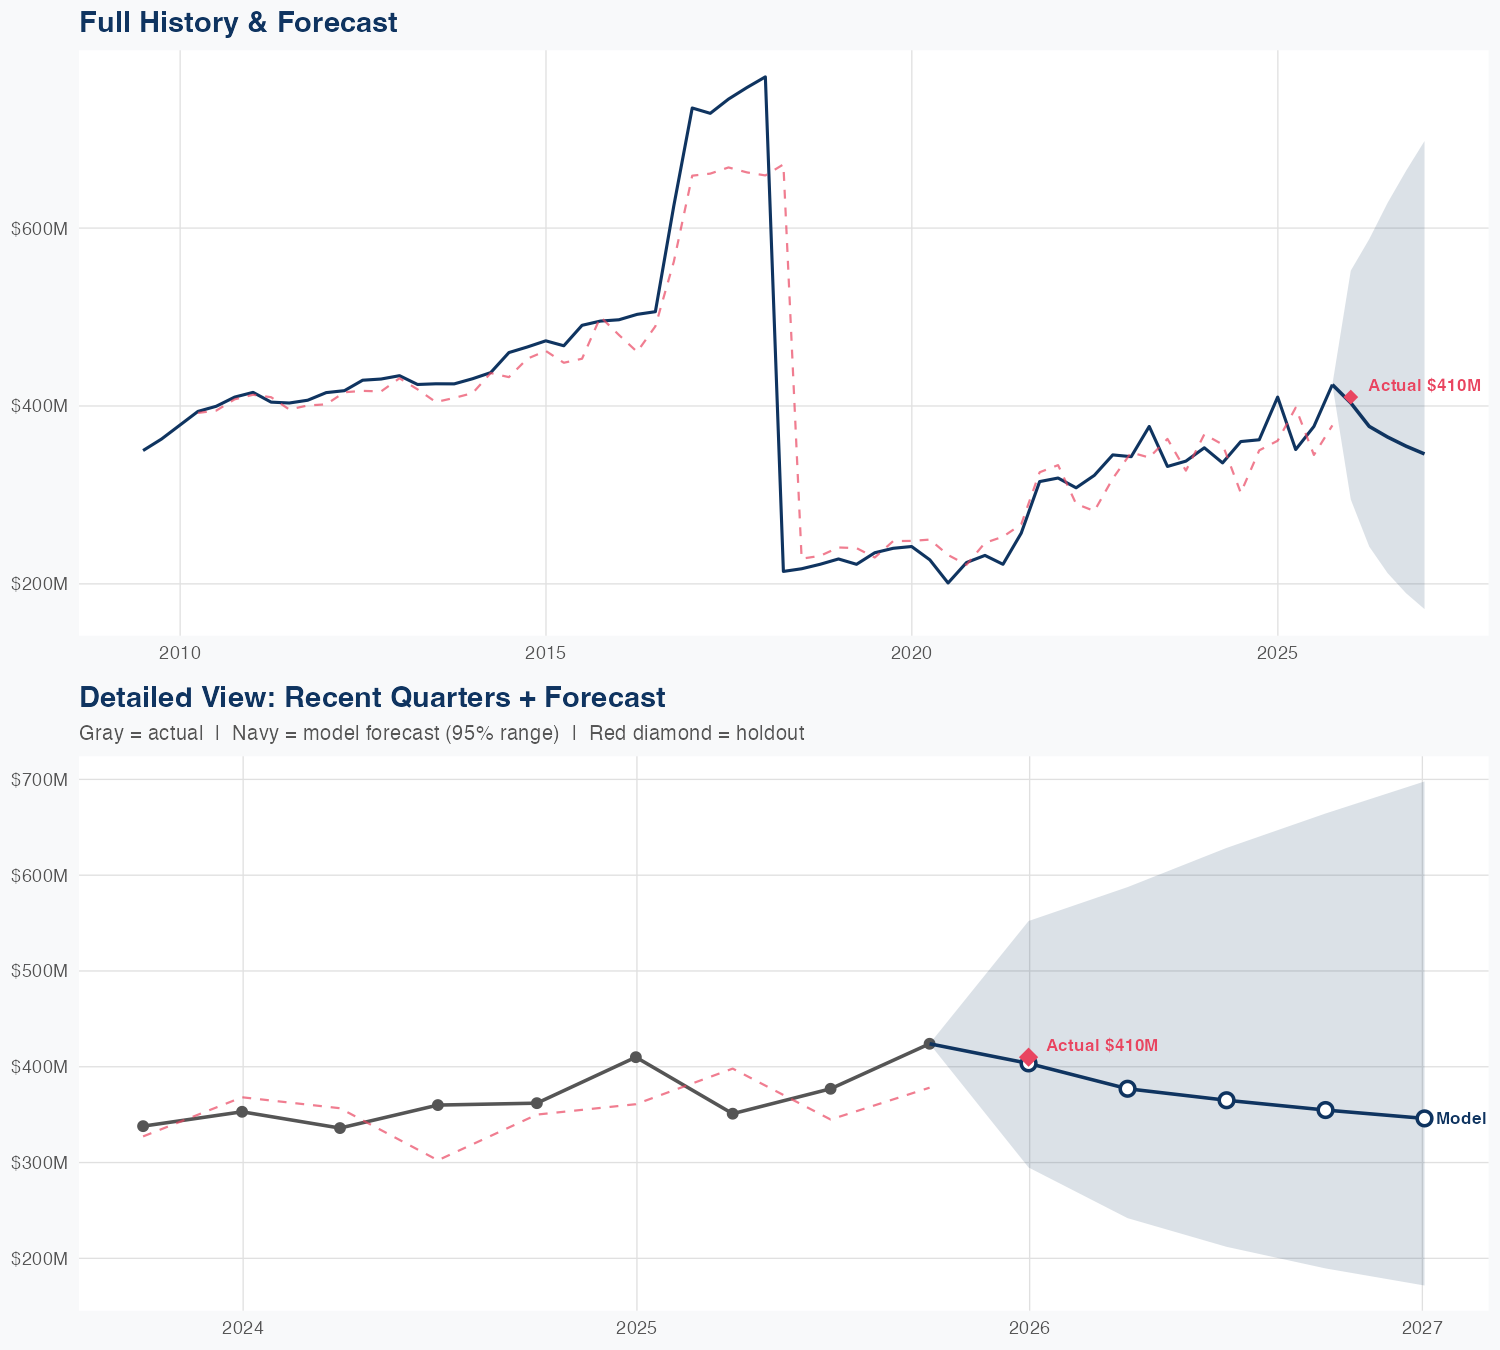
Quarterly Detail
| Quarter | Model Forecast | Actual | 95% Range | YoY Growth | Status |
|---|---|---|---|---|---|
| Q4 2025 | $413B | $410B | $277B – $616B | +0.7% | ✓ In range |
| Q2 2026 | $390B | $252B – $605B | +11.2% | ||
| Q3 2026 | $398B | $247B – $642B | +5.7% | ||
| Q4 2026 | $406B | $240B – $686B | -4.3% | ||
| Q1 2027 | $421B | $237B – $751B | +2.8% |
Seasonal Factors
| Fiscal Quarter | Seasonal Factor | vs Trend | Interpretation | Obs. |
|---|---|---|---|---|
| FQ1 (Sep–Nov) | 1.0327 | +3.3% | +3.3% above trend | 16 |
| FQ2 (Dec–Feb) | 1.0067 | +0.7% | In line with trend | 16 |
| FQ3 (Mar–May) | 1.0043 | +0.4% | In line with trend | 16 |
| FQ4 (Jun–Aug) | 1.0335 | +3.4% | +3.4% above trend | 16 |
How Spending Drives Revenue
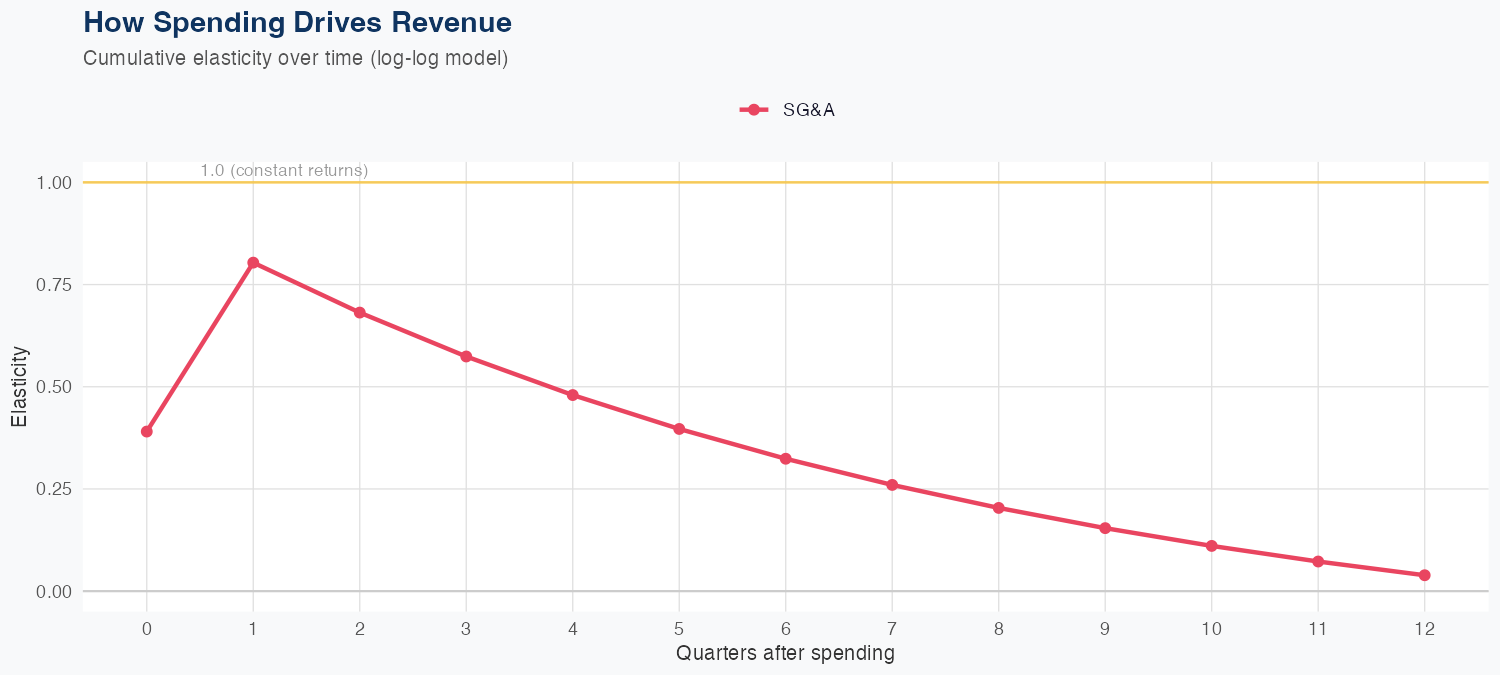
Spending Efficiency Over Time
Current SG&A elasticity: 0.326x
Want this analysis for your portfolio?
I build custom revenue intelligence reports for investors and companies using SEC filing data, econometric modeling, and AI-powered insights.
Get in Touch