Hilton Worldwide Holdings Inc. HLT
Revenue Intelligence Report • 52 quarters of SEC filing data • Updated 2026-03-15
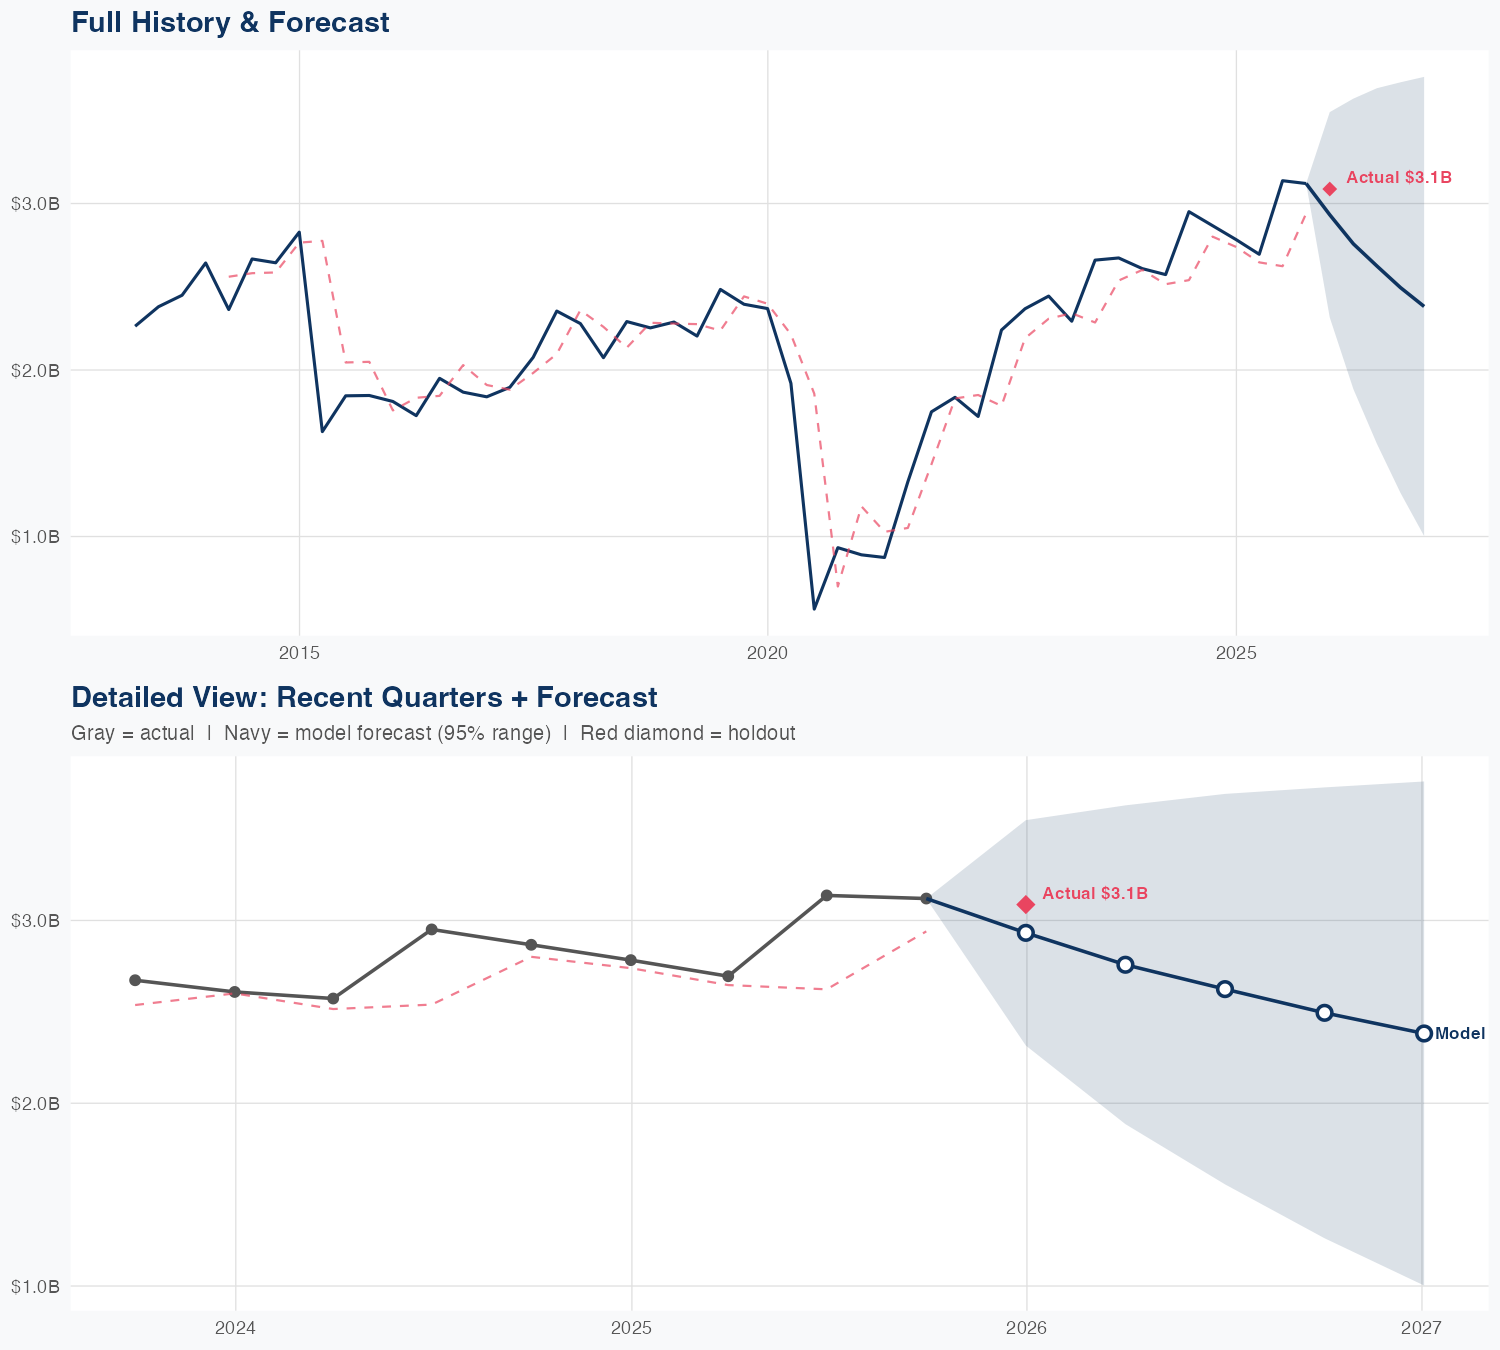
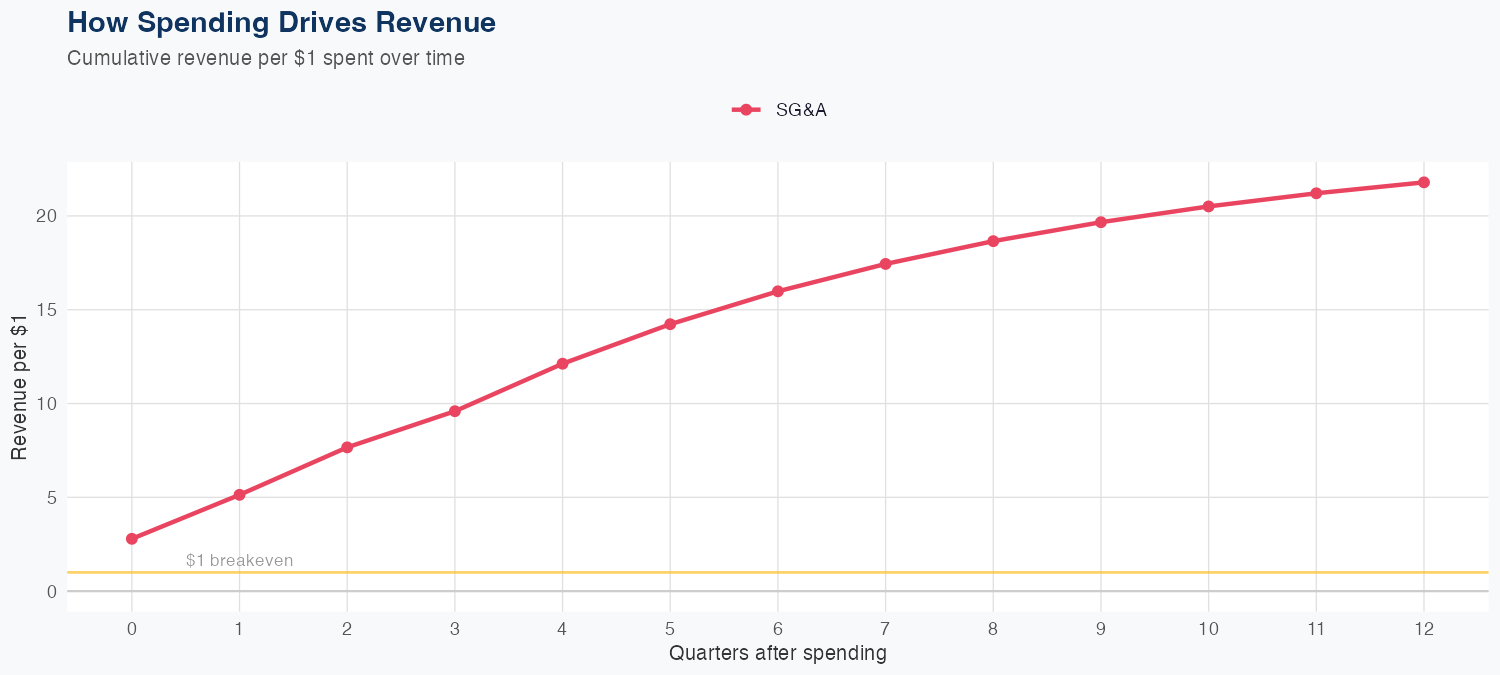
Revenue is driven by demand and pricing dynamics across its global hotel portfolio, with occupancy and average daily rate shaping top-line growth. The model estimates a strong ROI on SG&A, with $1 of SG&A generating $21.79 in long-run revenue, suggesting marketing and administrative investments are highly efficient revenue drivers. The modeling shows reasonable short-term reliability, with a holdout prediction of $2.9B versus actual $3.1B (5.0% error) and an overall MAPE of 13.7%. The FY revenue forecast is about $10B, down 14.8% year over year, signaling near-term headwinds but potential for a rebound as travel demand normalizes.
Investment Thesis
At 13.7% MAPE, the model captures Hilton Worldwide Holdings Inc.'s broad revenue trajectory, though quarterly variability suggests sensitivity to external factors. Each $1 of SG&A spending generates $21.79 in revenue, reflecting strong commercial efficiency.
Revenue Forecast
Quarterly Detail
| Quarter | Model Forecast | Actual | 95% Range | YoY Growth | Status |
|---|---|---|---|---|---|
| Q4 2025 | $2.9B | $3.1B | $2.3B – $3.5B | +5.4% | ✓ In range |
| Q2 2026 | $2.8B | $1.9B – $3.6B | +2.3% | ||
| Q3 2026 | $2.6B | $1.6B – $3.7B | -16.3% | ||
| Q4 2026 | $2.5B | $1.3B – $3.7B | -20.0% | ||
| Q1 2027 | $2.4B | $1.0B – $3.8B | -22.8% |
Seasonal Factors
| Fiscal Quarter | Seasonal Factor | vs Trend | Interpretation | Obs. |
|---|---|---|---|---|
| FQ1 (Sep–Nov) | 1.0534 | +5.3% | +5.3% above trend | 12 |
| FQ2 (Dec–Feb) | 1.0041 | +0.4% | In line with trend | 12 |
| FQ3 (Mar–May) | 0.9415 | -5.8% | -5.8% below trend | 12 |
| FQ4 (Jun–Aug) | 1.1104 | +11.0% | +11.0% above trend | 12 |
How Spending Drives Revenue
Want this analysis for your portfolio?
I build custom revenue intelligence reports for investors and companies using SEC filing data, econometric modeling, and AI-powered insights.
Get in Touch