Illumina, Inc. ILMN
Revenue Intelligence Report • 57 quarters of SEC filing data • Updated 2026-03-15
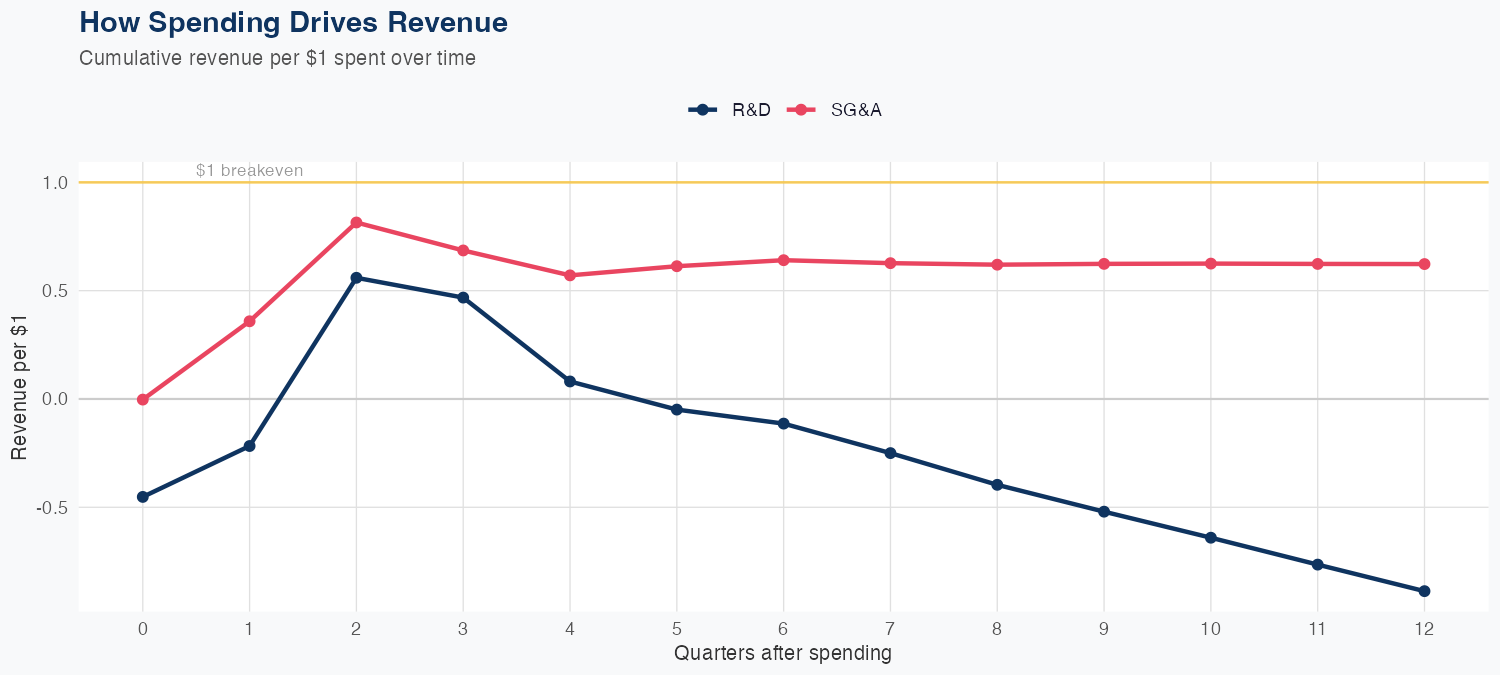
The model shows SG&A spending has a positive long-run revenue impact (0.62 per $1) while R&D spending has a negative long-run impact (-0.89 per $1), suggesting revenue growth is more sensitive to SG&A efficiency and strategy than to R&D intensity. With 57 quarters of data, the linear model achieves a 5.2% MAPE, but the holdout test shows a 7.6% error (predicted $1.10B vs actual $1.20B) indicating modest precision. The latest quarterly revenue is $1.159B, and the FY forecast is $4.1B, down 6.5% year over year, signaling a softer near-term environment. Outlook: aligning spend toward SG&A-driven growth while moderating R&D could improve the revenue trajectory, though the full-year view remains modest with subdued growth expected.
Investment Thesis
The econometric model achieves strong accuracy (5.2% MAPE), suggesting Illumina, Inc.'s revenue trajectory is well-characterized by its spending patterns. Each $1 of SG&A spending generates $0.62 in revenue, reflecting strong commercial efficiency.
Revenue Forecast
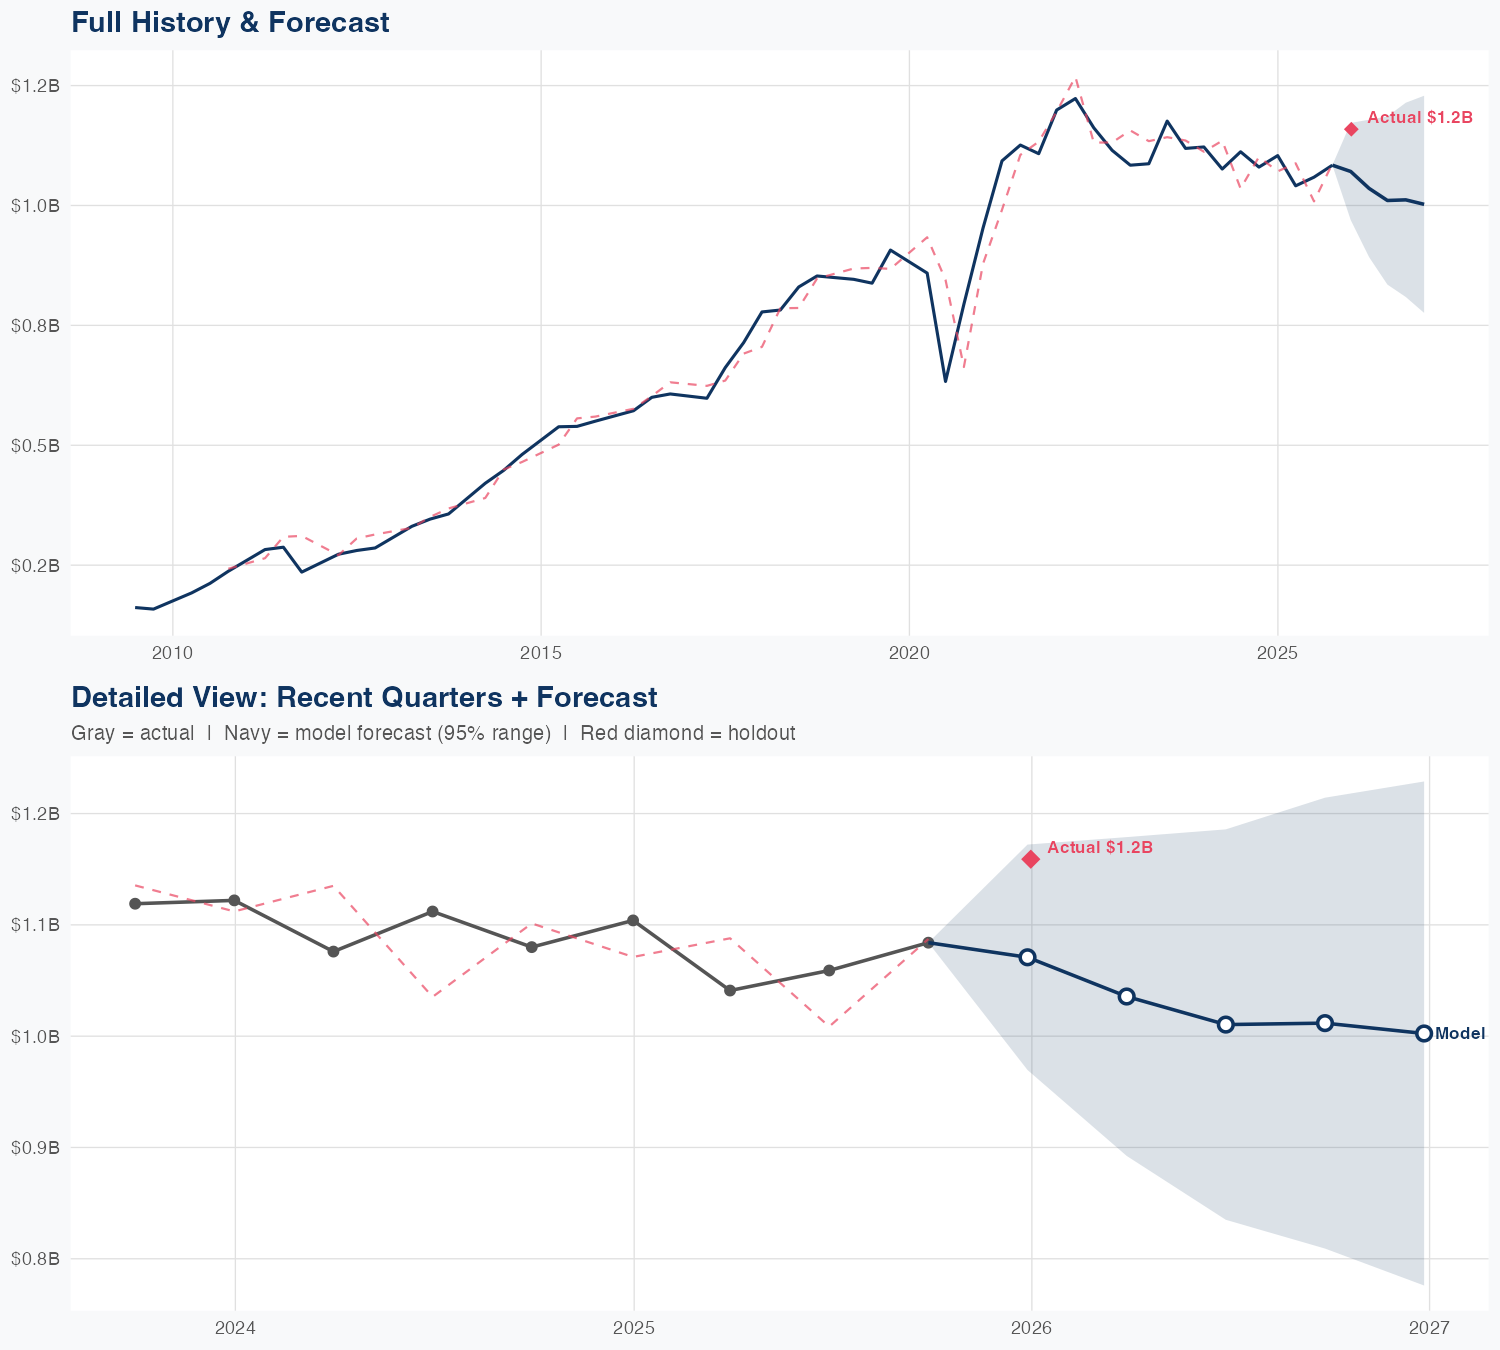
Quarterly Detail
| Quarter | Model Forecast | Actual | 95% Range | YoY Growth | Status |
|---|---|---|---|---|---|
| Q4 2025 | $1.1B | $1.2B | $1.0B – $1.2B | -3.0% | ✓ In range |
| Q1 2026 | $1.0B | $0.9B – $1.2B | -0.5% | ||
| Q2 2026 | $1.0B | $0.8B – $1.2B | -4.6% | ||
| Q3 2026 | $1.0B | $0.8B – $1.2B | -6.7% | ||
| Q4 2026 | $1.0B | $0.8B – $1.2B | -13.5% |
Seasonal Factors
| Fiscal Quarter | Seasonal Factor | vs Trend | Interpretation | Obs. |
|---|---|---|---|---|
| FQ1 (Sep–Nov) | 0.9855 | -1.5% | In line with trend | 16 |
| FQ2 (Dec–Feb) | 1.0306 | +3.1% | +3.1% above trend | 7 |
| FQ3 (Mar–May) | 0.9929 | -0.7% | In line with trend | 15 |
| FQ4 (Jun–Aug) | 0.9958 | -0.4% | In line with trend | 15 |
How Spending Drives Revenue
Want this analysis for your portfolio?
I build custom revenue intelligence reports for investors and companies using SEC filing data, econometric modeling, and AI-powered insights.
Get in Touch