Insmed Incorporated INSM
Revenue Intelligence Report • 44 quarters of SEC filing data • Updated 2026-03-15
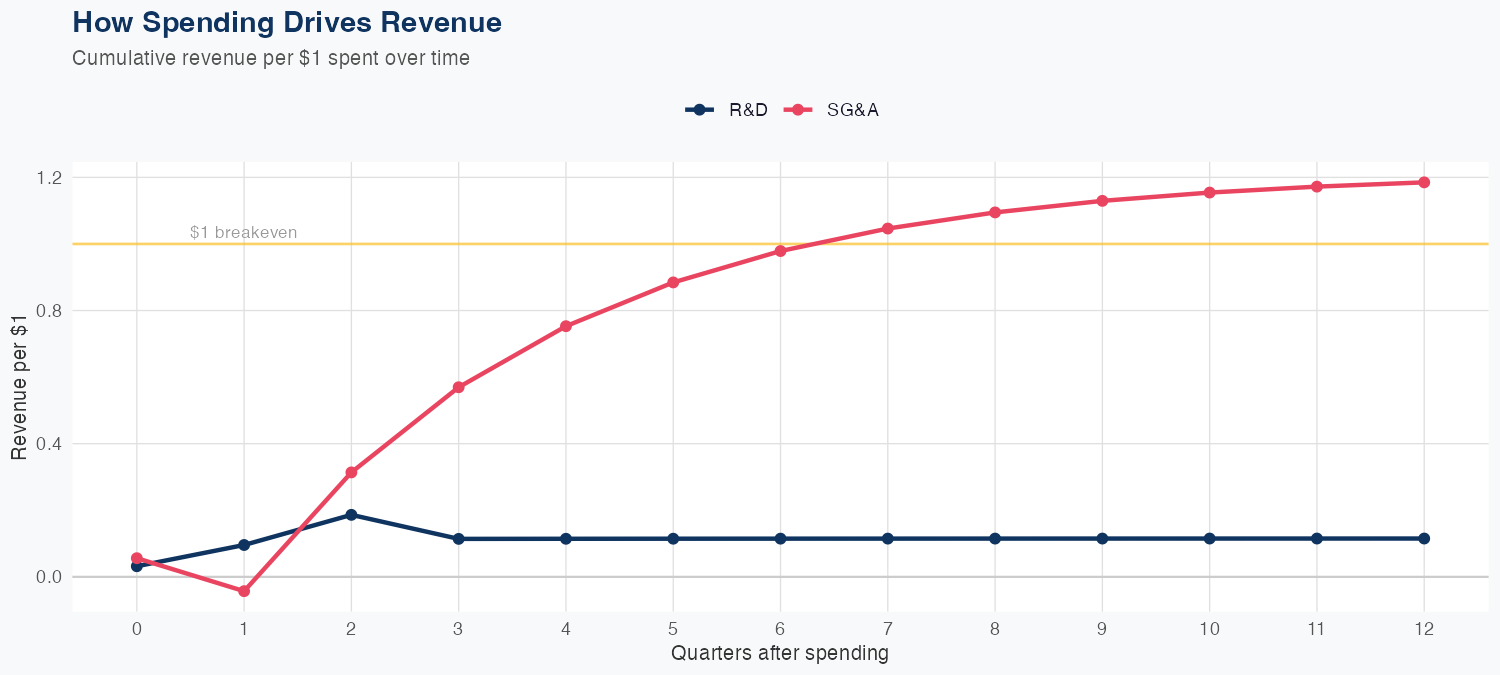
Revenue is driven more by SG&A spending than R&D, with the model implying 1.18 dollars of long-run revenue per dollar of SG&A versus 0.12 dollars per dollar of R&D. Holdout results show a 4% miss (predicted 90M vs actual 93M), indicating reasonable short-term predictive accuracy despite an anomalous Inf% MAPE metric. The FY forecast calls for about $427M in revenue, up around 24% year over year. Going forward, SG&A efficiency will be the key driver of upside while R&D contributes primarily to long-term growth and pipeline value.
Investment Thesis
Every $1 of R&D investment is associated with $0.12 of revenue, indicating efficient capital deployment in innovation. Each $1 of SG&A spending generates $1.19 in revenue, reflecting strong commercial efficiency.
Revenue Forecast
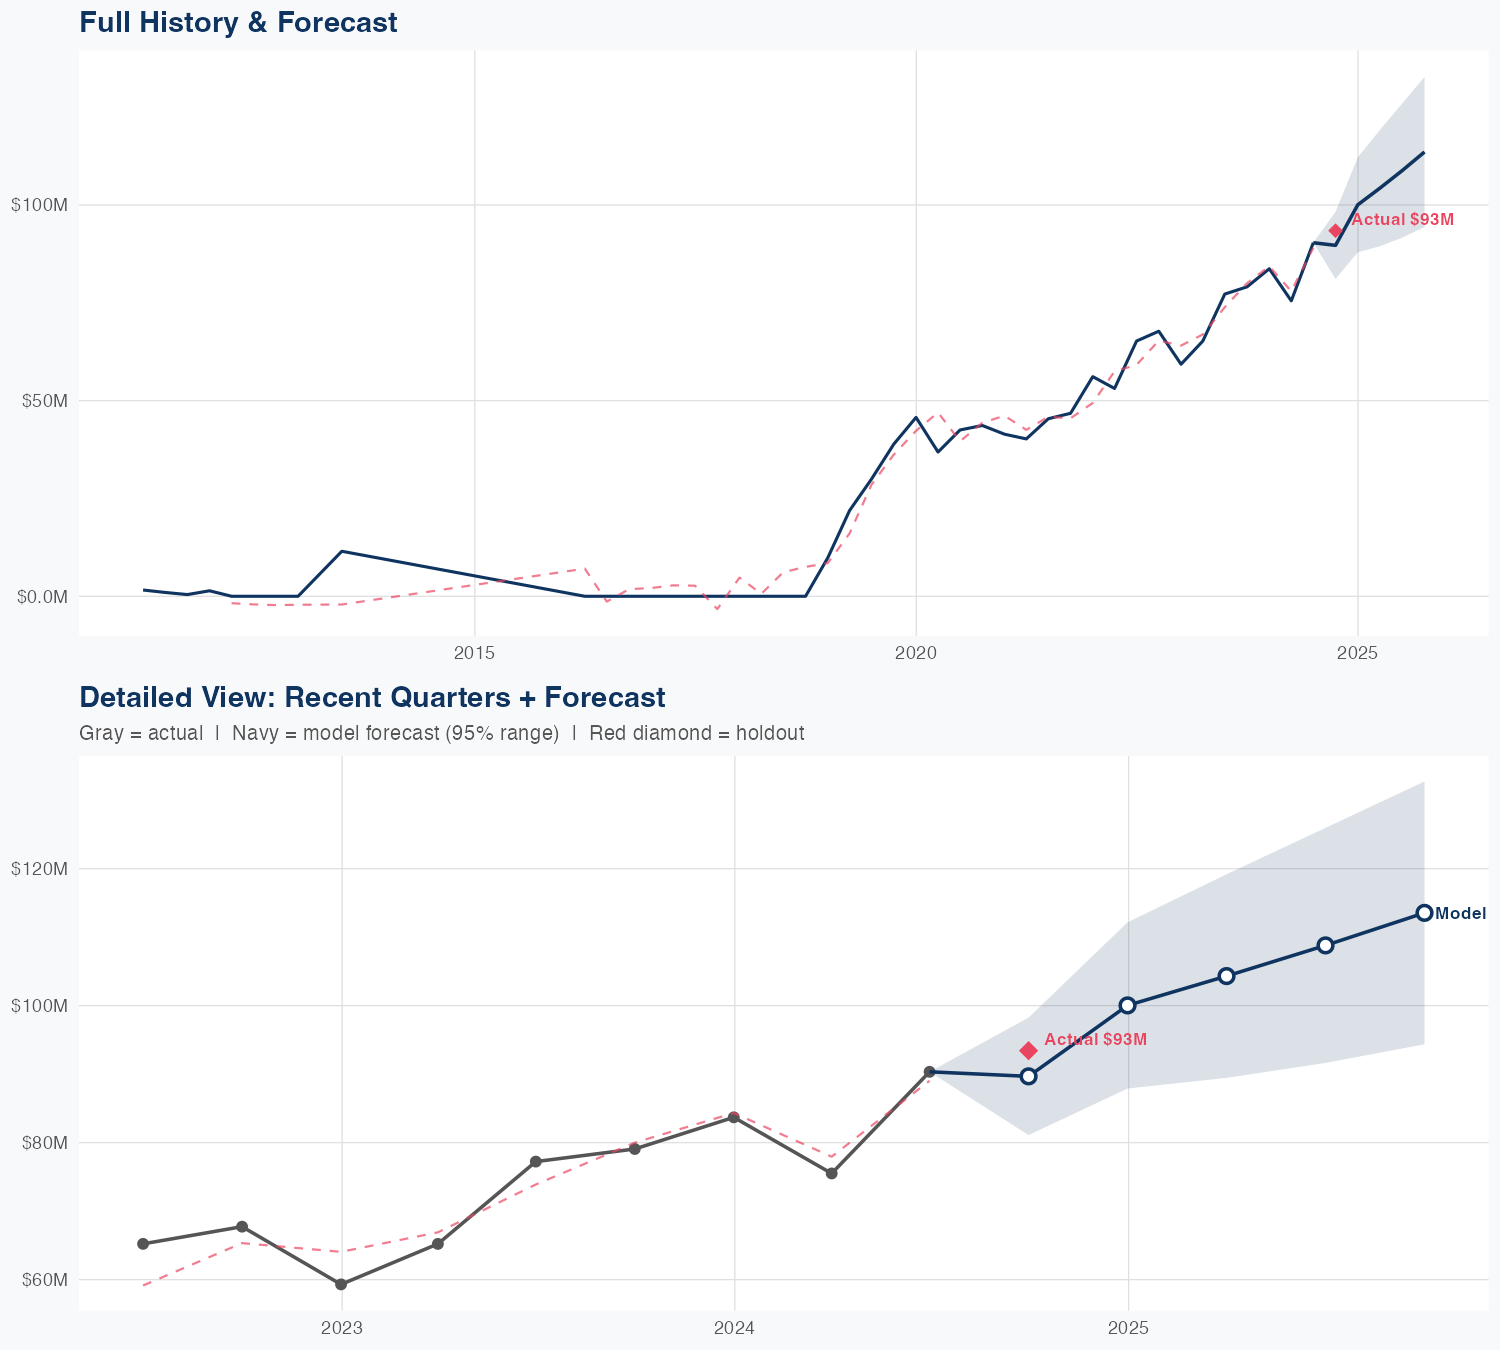
Quarterly Detail
| Quarter | Model Forecast | Actual | 95% Range | YoY Growth | Status |
|---|---|---|---|---|---|
| Q3 2024 | $90M | $93M | $81M – $98M | +13.4% | ✓ In range |
| Q4 2024 | $100M | $88M – $112M | +19.5% | ||
| Q2 2025 | $104M | $89M – $119M | +38.2% | ||
| Q3 2025 | $109M | $92M – $126M | +20.4% | ||
| Q4 2025 | $114M | $94M – $133M | +21.5% |
Seasonal Factors
| Fiscal Quarter | Seasonal Factor | vs Trend | Interpretation | Obs. |
|---|---|---|---|---|
| FQ1 (Sep–Nov) | 1.0367 | +3.7% | +3.7% above trend | 6 |
| FQ2 (Dec–Feb) | 1.0808 | +8.1% | +8.1% above trend | 6 |
| FQ3 (Mar–May) | 0.9686 | -3.1% | -3.1% below trend | 6 |
| FQ4 (Jun–Aug) | 1.0504 | +5.0% | +5.0% above trend | 6 |
How Spending Drives Revenue
Want this analysis for your portfolio?
I build custom revenue intelligence reports for investors and companies using SEC filing data, econometric modeling, and AI-powered insights.
Get in Touch