Itt Inc. ITT
Revenue Intelligence Report • 60 quarters of SEC filing data • Updated 2026-03-15
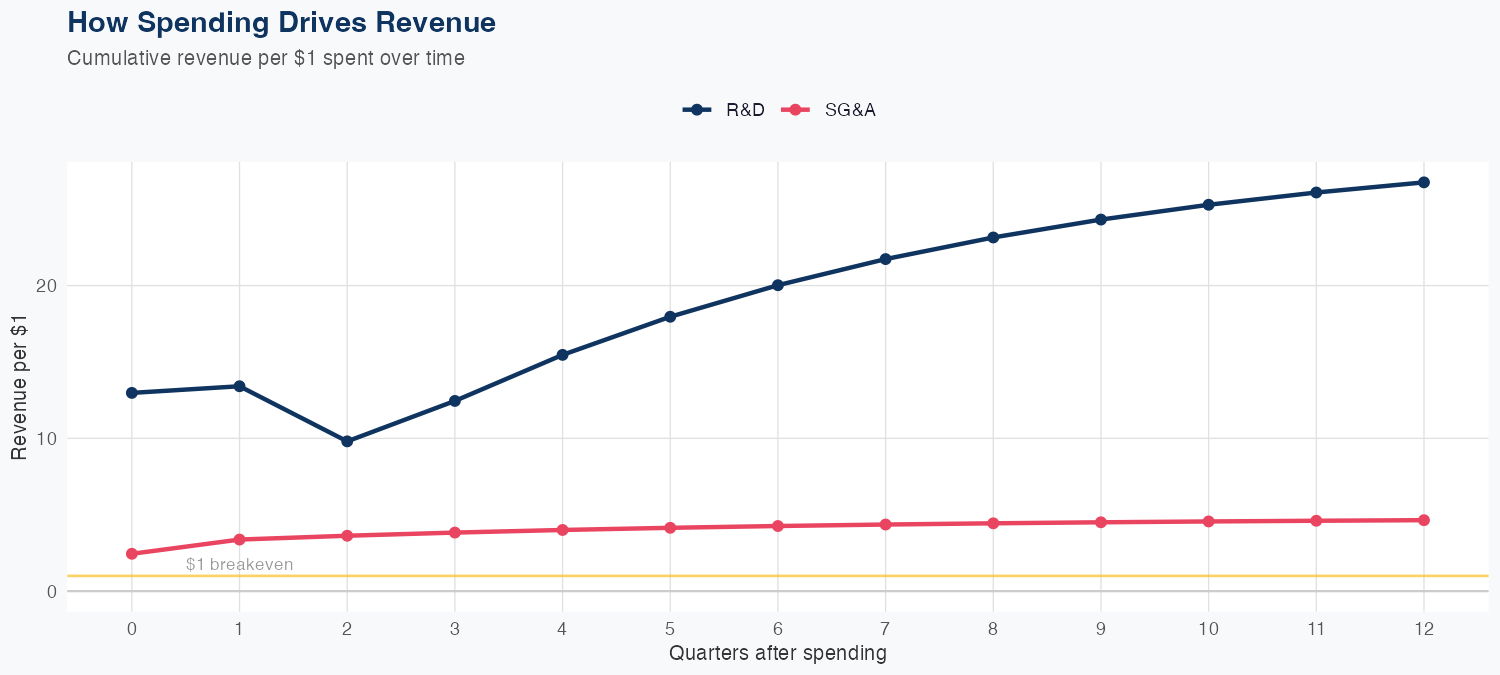
Revenue is driven primarily by R&D investments, which yield approximately $26.75 in long-run revenue for every $1 spent, versus about $4.65 in long-run revenue per $1 of SG&A. Latest quarterly revenue was $1.054 billion, with a full-year forecast of $4.1 billion, representing about 3.9% year-over-year growth. Model performance is solid at 2.9% MAPE, with a holdout test showing predicted $1.0B versus actual $1.1B (5.3% error). Overall, the outlook remains constructive as R&D-driven revenue expansion supports mid-single-digit growth, while disciplined SG&A spending provides more modest incremental gains.
Investment Thesis
Our ARDL model tracks Itt Inc.'s revenue with exceptional precision (2.9% MAPE), indicating highly predictable cash flows. Every $1 of R&D investment is associated with $26.75 of revenue, indicating efficient capital deployment in innovation. Each $1 of SG&A spending generates $4.65 in revenue, reflecting strong commercial efficiency.
Revenue Forecast
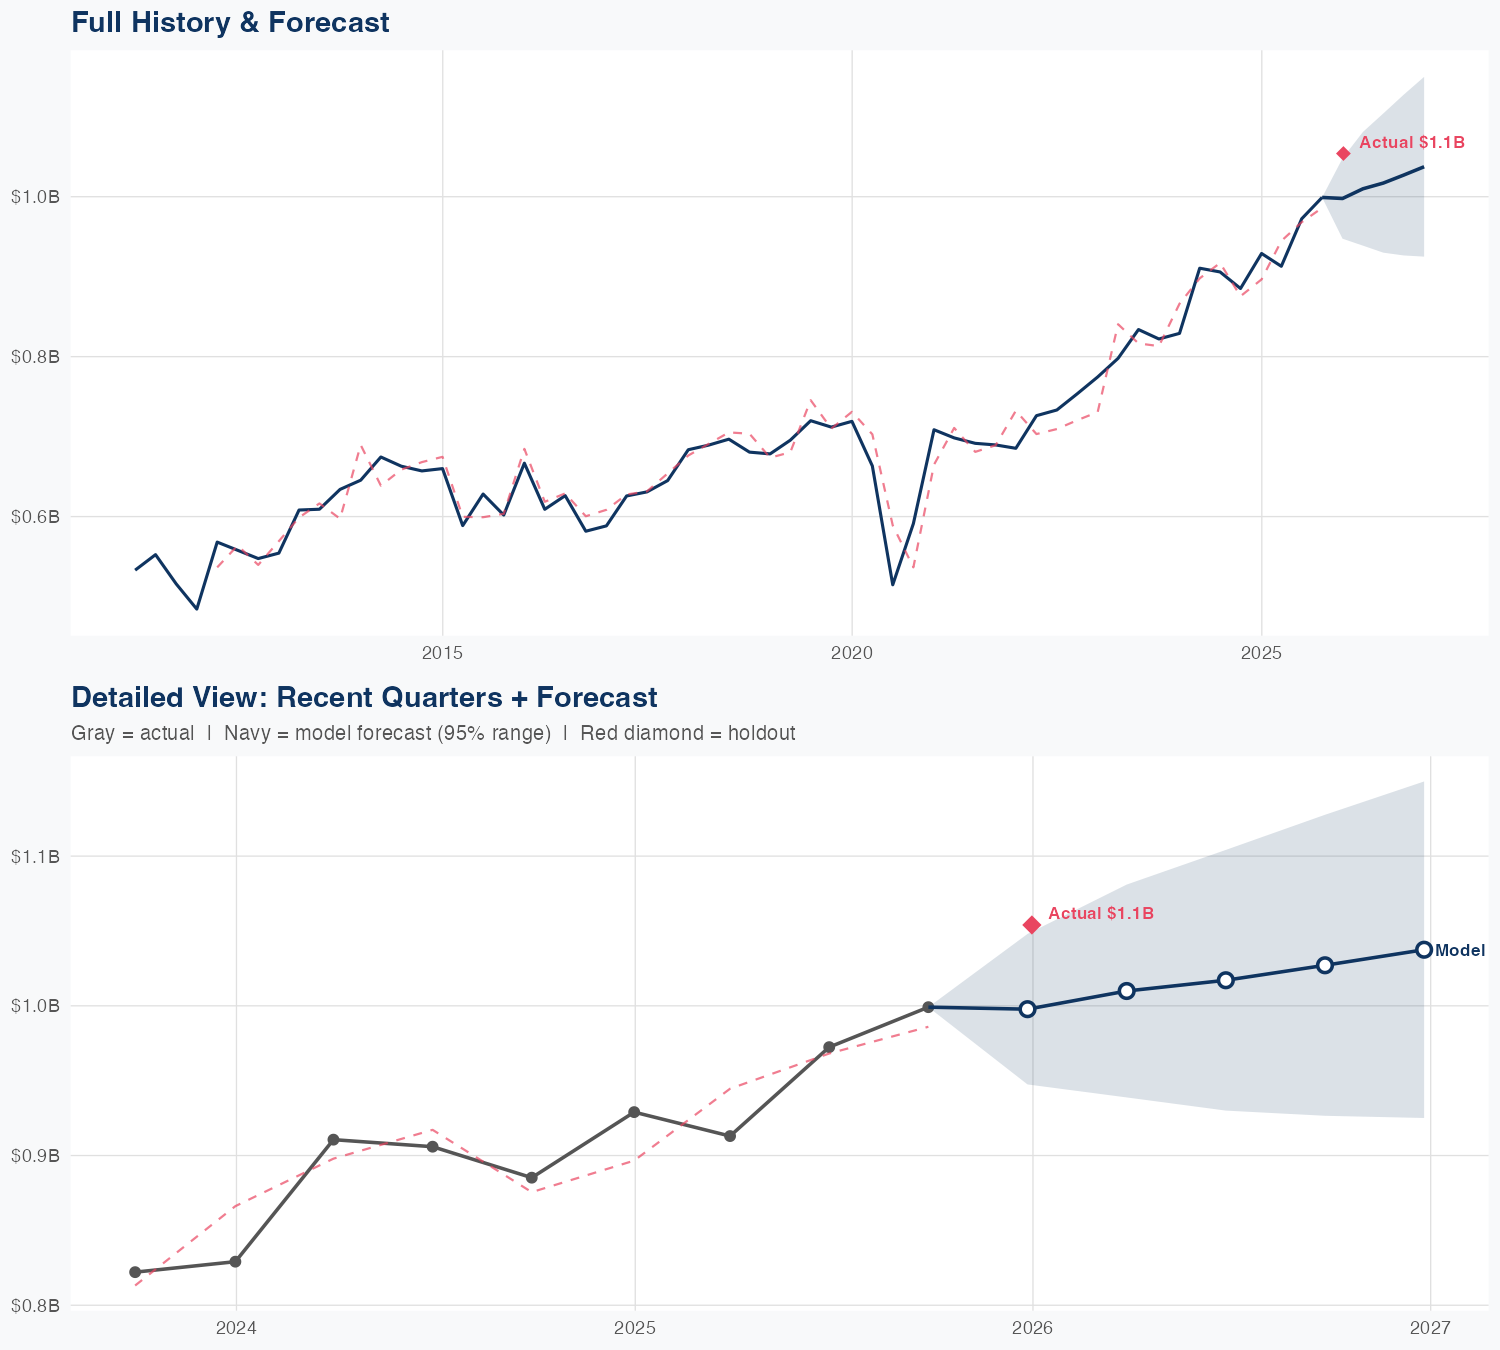
Quarterly Detail
| Quarter | Model Forecast | Actual | 95% Range | YoY Growth | Status |
|---|---|---|---|---|---|
| Q4 2025 | $1.0B | $1.1B | $0.9B – $1.0B | +7.4% | ✗ Outside range |
| Q1 2026 | $1.0B | $0.9B – $1.1B | +10.6% | ||
| Q2 2026 | $1.0B | $0.9B – $1.1B | +4.6% | ||
| Q3 2026 | $1.0B | $0.9B – $1.1B | +2.8% | ||
| Q4 2026 | $1.0B | $0.9B – $1.1B | -1.6% |
Seasonal Factors
| Fiscal Quarter | Seasonal Factor | vs Trend | Interpretation | Obs. |
|---|---|---|---|---|
| FQ1 (Sep–Nov) | 1.011 | +1.1% | In line with trend | 14 |
| FQ2 (Dec–Feb) | 0.9837 | -1.6% | In line with trend | 14 |
| FQ3 (Mar–May) | 0.9979 | -0.2% | In line with trend | 14 |
| FQ4 (Jun–Aug) | 0.9989 | -0.1% | In line with trend | 14 |
How Spending Drives Revenue
Want this analysis for your portfolio?
I build custom revenue intelligence reports for investors and companies using SEC filing data, econometric modeling, and AI-powered insights.
Get in Touch