J.b. Hunt Transport Services, Inc. JBHT
Revenue Intelligence Report • 36 quarters of SEC filing data • Updated 2026-03-15
Revenue is forecast to decline about 0.7% year over year, with JB Hunt likely stabilizing only modestly as platform-scale advantages and pricing power offset softer demand. Binding constraint: delivery capacity and driver availability in JB Hunt's network cap upside, meaning incremental SG&A spend cannot fully translate into additional revenue without expanding capacity. Our econometric model suggests structural/platform growth is the primary growth engine, with SG&A contributing modest incremental gains and elasticities indicating spending moves are not the main driver. Key risk: a sustained capacity constraint or a renewed downturn in freight volumes could keep revenue under pressure despite platform improvements.
Investment Thesis
The econometric model achieves strong accuracy (4.4% MAPE), suggesting J.b. Hunt Transport Services, Inc.'s revenue trajectory is well-characterized by its spending patterns.
Revenue Forecast
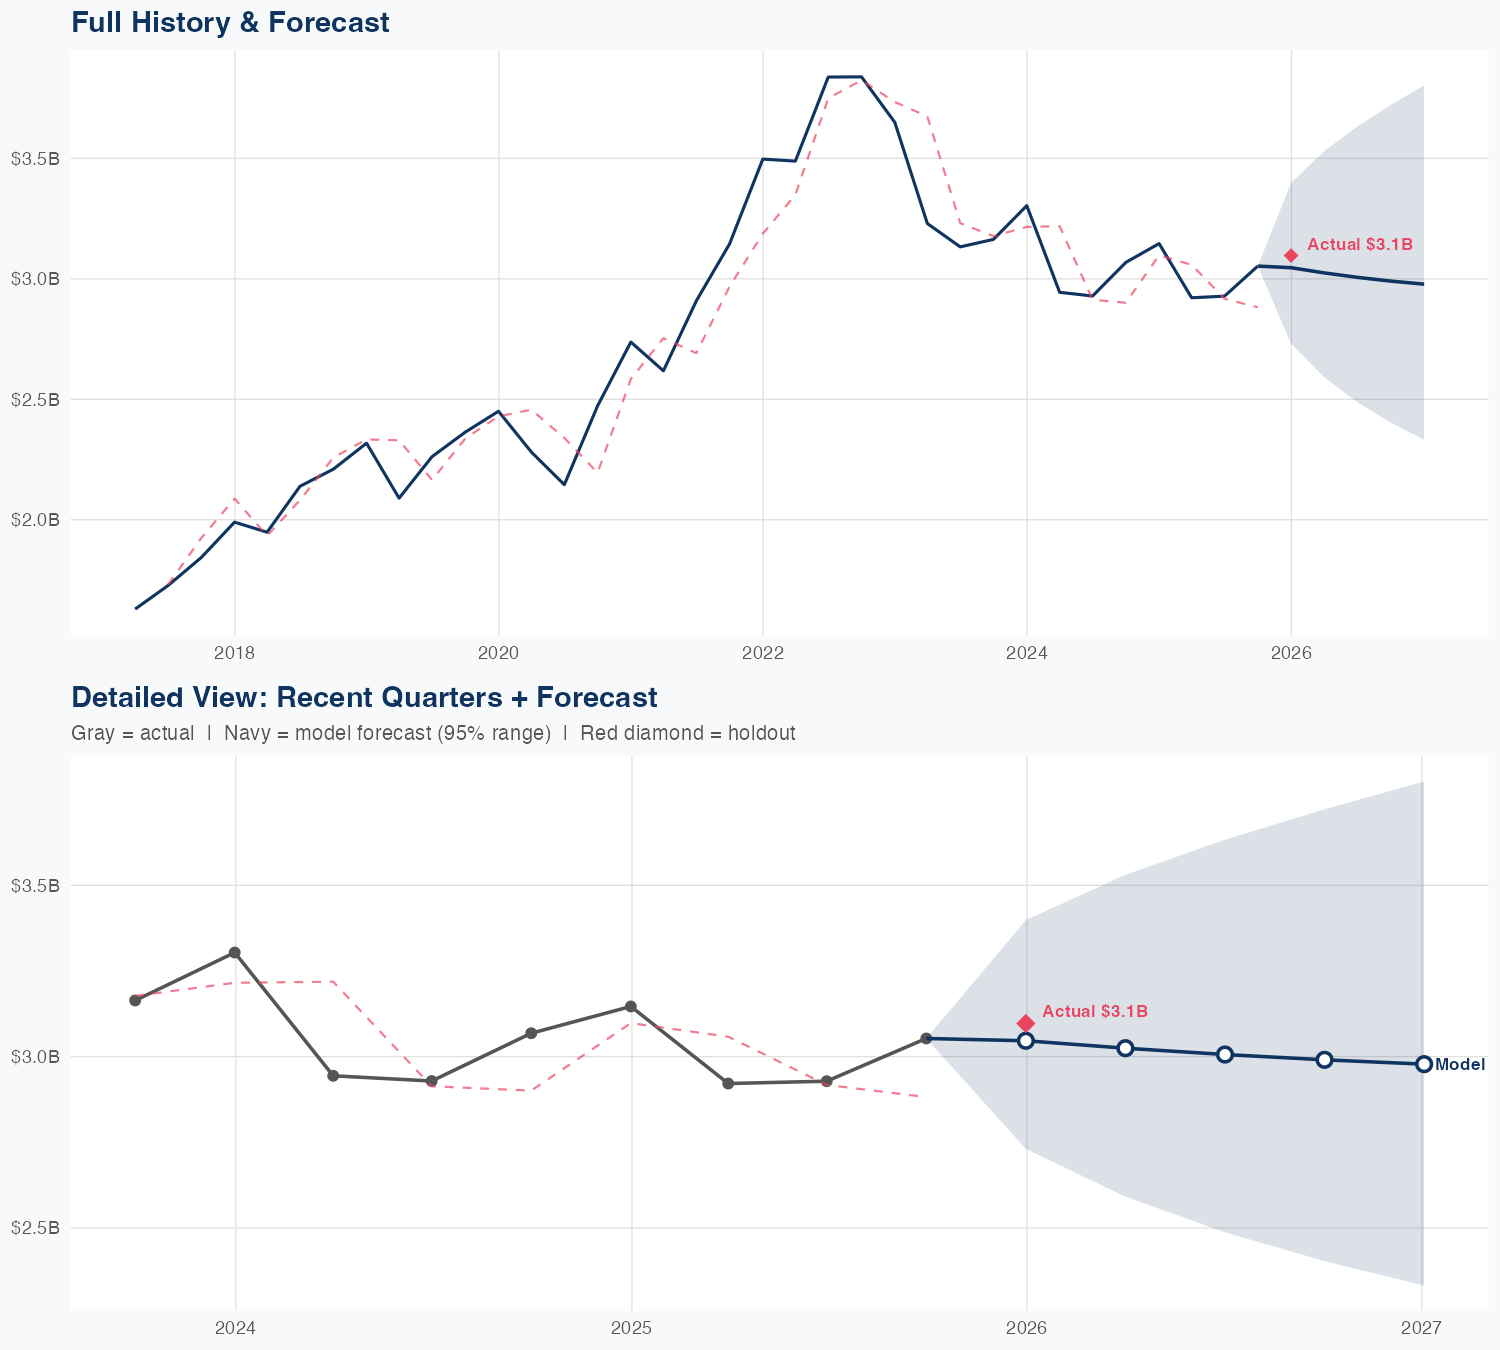
Quarterly Detail
| Quarter | Model Forecast | Actual | 95% Range | YoY Growth | Status |
|---|---|---|---|---|---|
| Q4 2025 | $3.1B | $3.1B | $2.8B – $3.5B | -1.6% | ✓ In range |
| Q2 2026 | $3.0B | $2.6B – $3.5B | +3.2% | ||
| Q3 2026 | $3.0B | $2.5B – $3.6B | +2.8% | ||
| Q4 2026 | $3.0B | $2.4B – $3.7B | -3.0% | ||
| Q1 2027 | $2.9B | $2.3B – $3.7B | -5.3% |
Seasonal Factors
| Fiscal Quarter | Seasonal Factor | vs Trend | Interpretation | Obs. |
|---|---|---|---|---|
| FQ1 (Sep–Nov) | 1.0113 | +1.1% | In line with trend | 9 |
| FQ2 (Dec–Feb) | 1.0157 | +1.6% | In line with trend | 9 |
| FQ3 (Mar–May) | 0.9507 | -4.9% | -4.9% below trend | 8 |
| FQ4 (Jun–Aug) | 1.0053 | +0.5% | In line with trend | 9 |
How Spending Drives Revenue
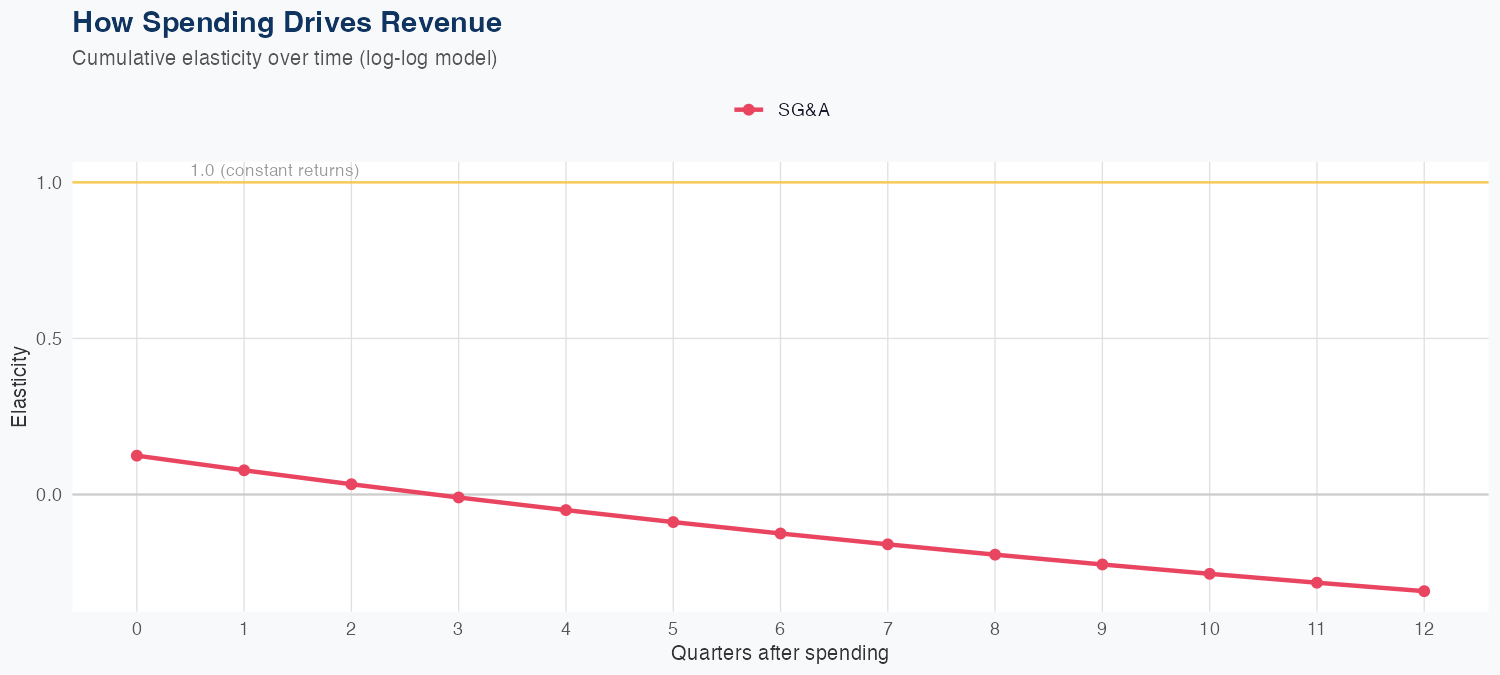
Spending Efficiency Over Time
Current SG&A elasticity: 0.1139x
Want this analysis for your portfolio?
I build custom revenue intelligence reports for investors and companies using SEC filing data, econometric modeling, and AI-powered insights.
Get in Touch