Jpmorgan Chase & Co JPM
Revenue Intelligence Report • 70 quarters of SEC filing data • Updated 2026-03-15
Revenue is projected to decline modestly year over year, about 1%, to roughly $93.5 billion. The softness reflects that growth comes more from platform scale, pricing power, and recurring revenue than incremental SG&A spending, with SG&A elasticity moving toward negative, indicating rising operating leverage. Our econometric model, with time-varying coefficients across 70 quarters, delivers a forecast with a 5.8% MAPE and a holdout error near 4% (predicted about $24B vs actual $25B). Key risk is the macro environment and rate path, since a sharper pullback in interest income or capital-market activity could push revenue meaningfully below the forecast.
Investment Thesis
The econometric model achieves strong accuracy (5.8% MAPE), suggesting Jpmorgan Chase & Co's revenue trajectory is well-characterized by its spending patterns. Sales & marketing spend shows a 1.02x elasticity, suggesting effective go-to-market execution.
Revenue Forecast
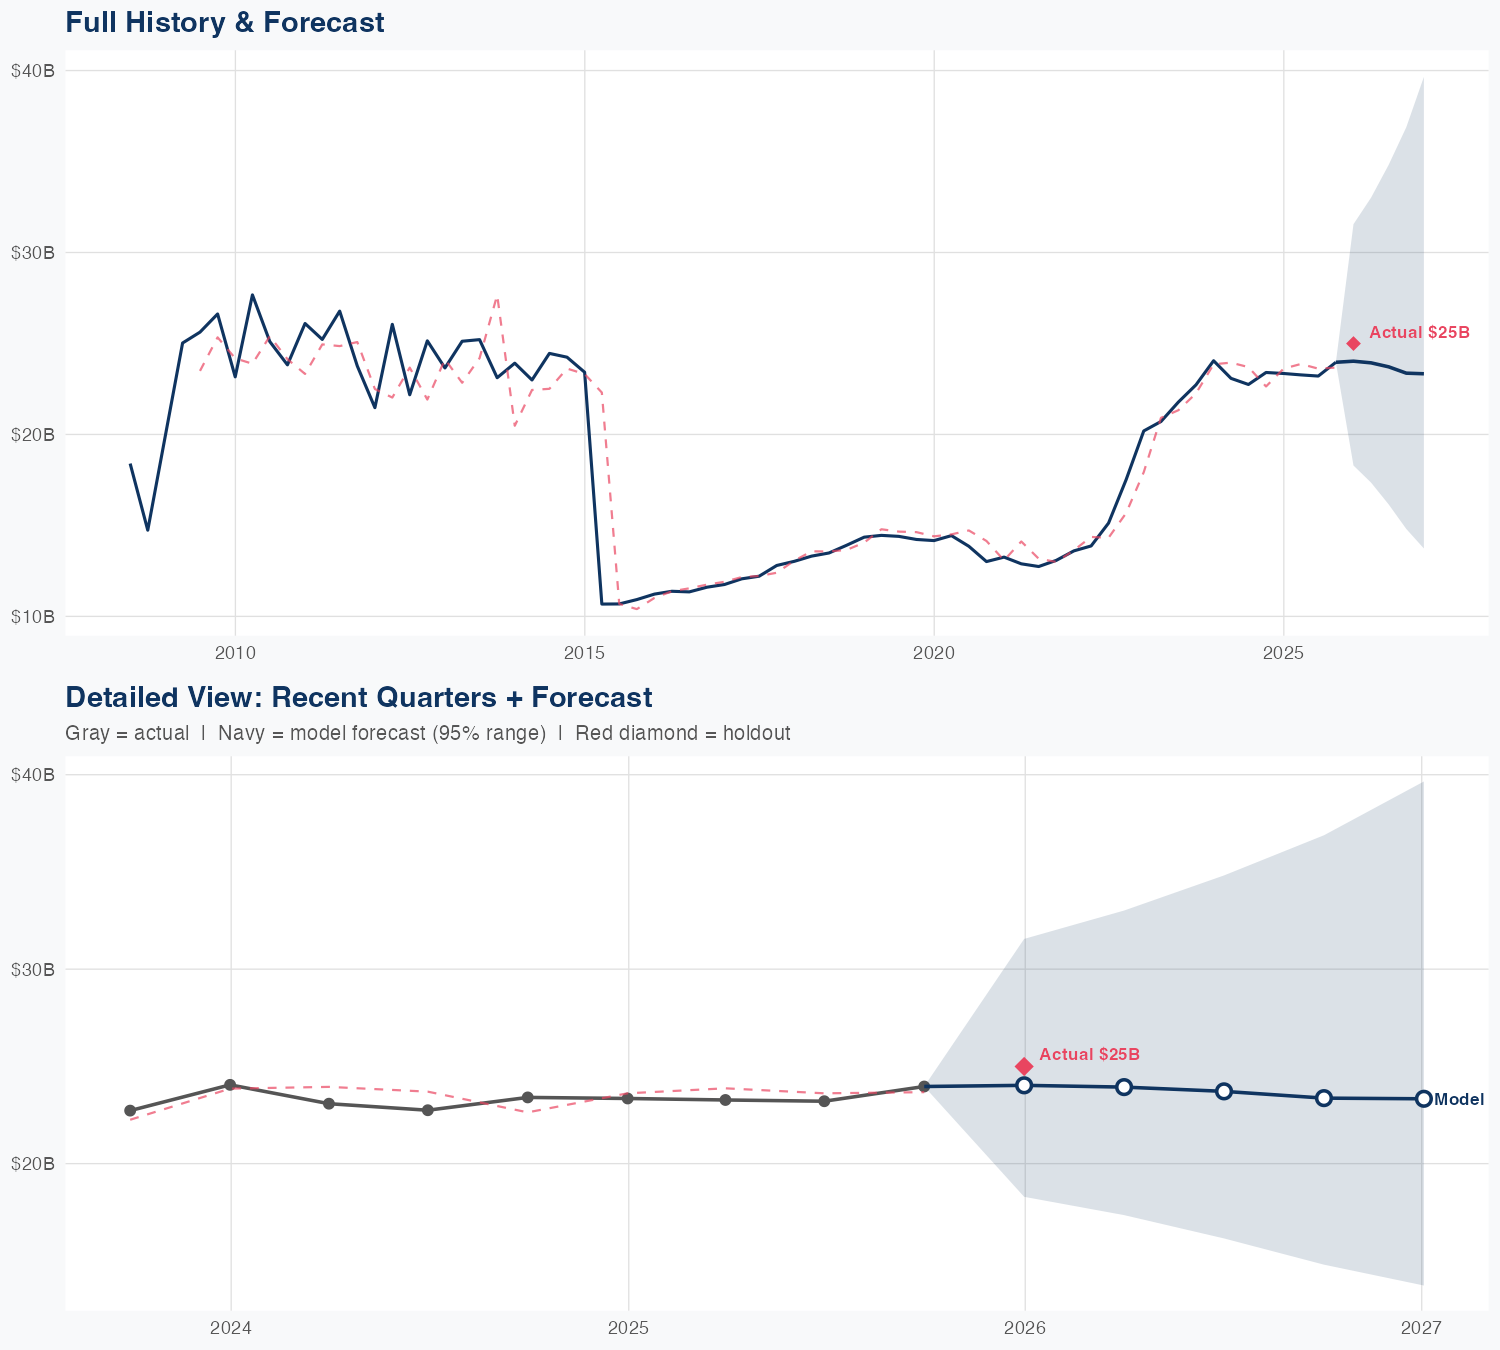
Quarterly Detail
| Quarter | Model Forecast | Actual | 95% Range | YoY Growth | Status |
|---|---|---|---|---|---|
| Q4 2025 | $24B | $25B | $18B – $32B | +2.9% | ✓ In range |
| Q2 2026 | $24B | $17B – $33B | +2.8% | ||
| Q3 2026 | $24B | $16B – $35B | +2.2% | ||
| Q4 2026 | $23B | $15B – $37B | -2.5% | ||
| Q1 2027 | $23B | $14B – $40B | -6.6% |
Latest Earnings Call
Q4 2025Seasonal Factors
| Fiscal Quarter | Seasonal Factor | vs Trend | Interpretation | Obs. |
|---|---|---|---|---|
| FQ1 (Sep–Nov) | 1.0187 | +1.9% | In line with trend | 17 |
| FQ2 (Dec–Feb) | 1.0042 | +0.4% | In line with trend | 17 |
| FQ3 (Mar–May) | 0.992 | -0.8% | In line with trend | 16 |
| FQ4 (Jun–Aug) | 0.994 | -0.6% | In line with trend | 17 |
How Spending Drives Revenue
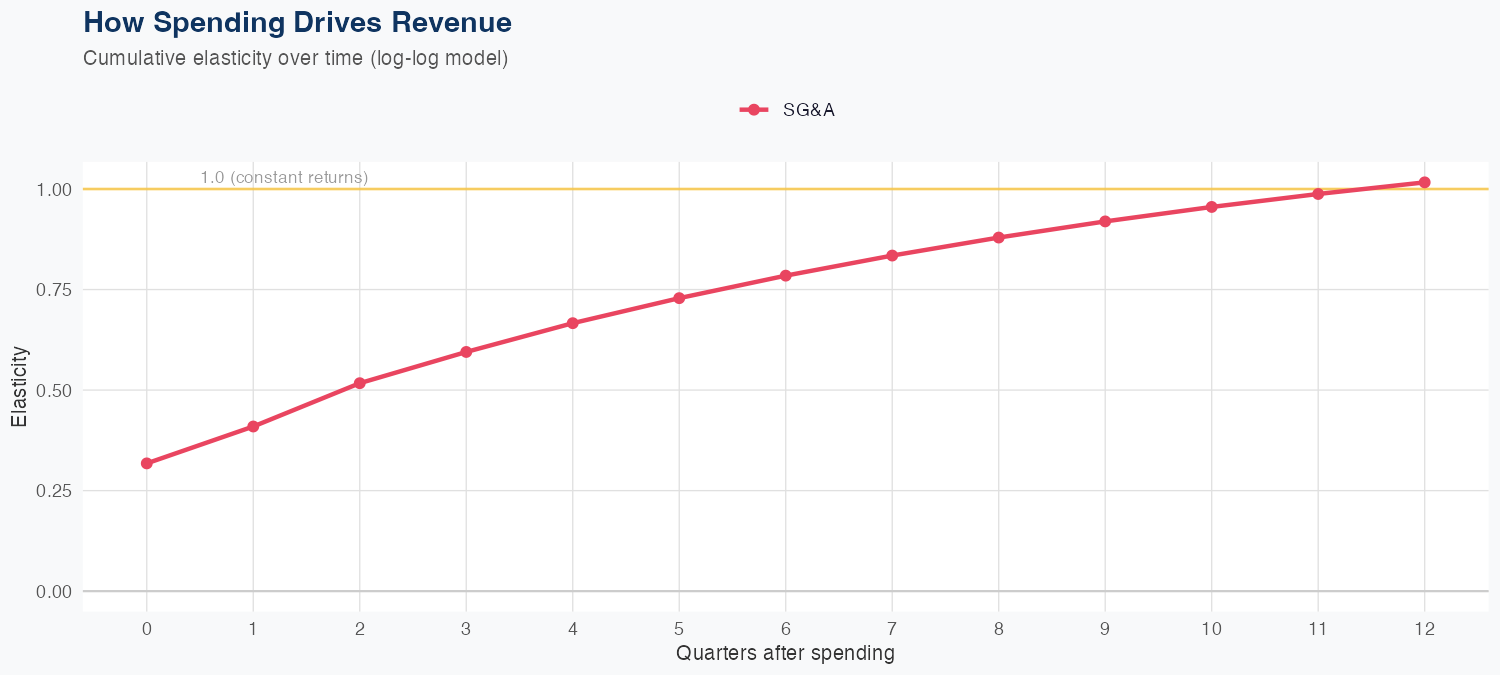
Spending Efficiency Over Time
Current SG&A elasticity: -0.3605x
Want this analysis for your portfolio?
I build custom revenue intelligence reports for investors and companies using SEC filing data, econometric modeling, and AI-powered insights.
Get in Touch