Keycorp KEY
Revenue Intelligence Report • 70 quarters of SEC filing data • Updated 2026-03-15
Revenue is expected to grow about 2.5% in the coming year, taking it to roughly $7.9 billion, a modest but positive trajectory for a regional bank. The path reflects a stabilizing balance sheet, with topline drivers supported by a more potent link between SG&A spend and revenue in our model, where SG&A elasticity sits around 1.9x and has risen over time. Our econometric model—built on a log-log framework with fixed coefficients—delivers a forecast with a history of around 9.8% MAPE, and a holdout showing a forecast of $1.9B versus actual $2.0B, which indicates reasonable reliability. Key risk: a softer macro backdrop or higher credit losses could temper growth more than anticipated.
Investment Thesis
At 9.8% MAPE, the model captures Keycorp's broad revenue trajectory, though quarterly variability suggests sensitivity to external factors. Sales & marketing spend shows a 1.93x elasticity, suggesting effective go-to-market execution.
Revenue Forecast
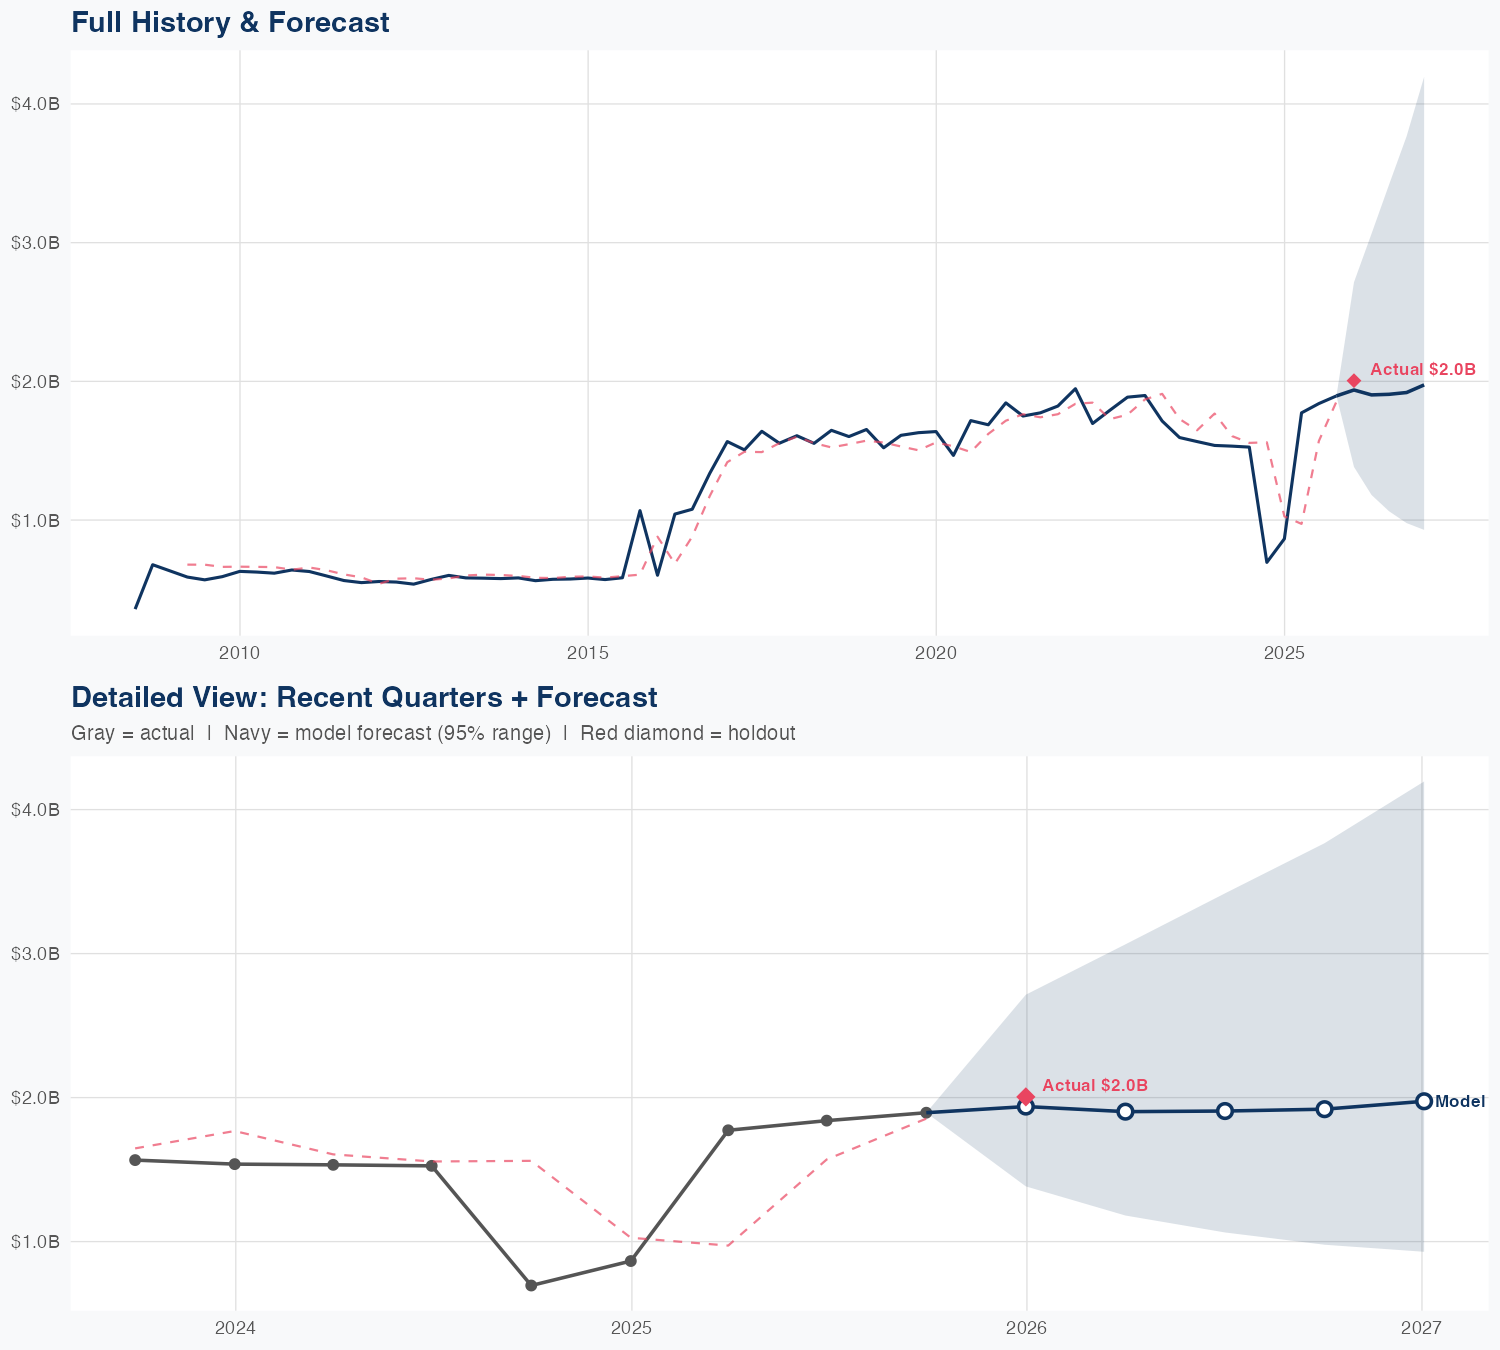
Quarterly Detail
| Quarter | Model Forecast | Actual | 95% Range | YoY Growth | Status |
|---|---|---|---|---|---|
| Q4 2025 | $1.9B | $2.0B | $1.4B – $2.7B | +124.0% | ✓ In range |
| Q2 2026 | $1.9B | $1.2B – $3.1B | +7.3% | ||
| Q3 2026 | $1.9B | $1.1B – $3.4B | +3.6% | ||
| Q4 2026 | $1.9B | $1.0B – $3.8B | +1.3% | ||
| Q1 2027 | $2.0B | $0.9B – $4.2B | -1.5% |
Seasonal Factors
| Fiscal Quarter | Seasonal Factor | vs Trend | Interpretation | Obs. |
|---|---|---|---|---|
| FQ1 (Sep–Nov) | 1.0042 | +0.4% | In line with trend | 17 |
| FQ2 (Dec–Feb) | 1.015 | +1.5% | In line with trend | 17 |
| FQ3 (Mar–May) | 0.964 | -3.6% | -3.6% below trend | 17 |
| FQ4 (Jun–Aug) | 0.985 | -1.5% | In line with trend | 17 |
How Spending Drives Revenue
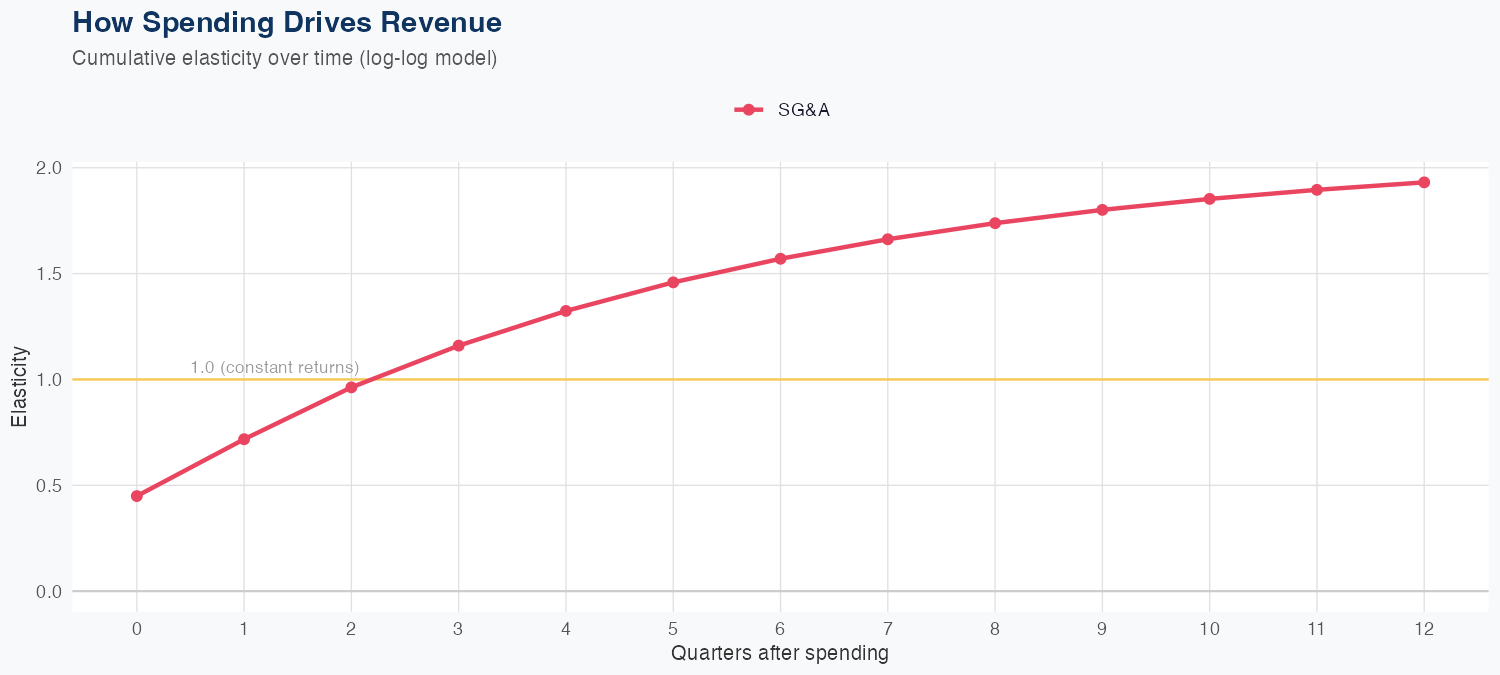
Spending Efficiency Over Time
Current SG&A elasticity: 1.1325x
Want this analysis for your portfolio?
I build custom revenue intelligence reports for investors and companies using SEC filing data, econometric modeling, and AI-powered insights.
Get in Touch