Kinder Morgan, Inc. KMI
Revenue Intelligence Report • 62 quarters of SEC filing data • Updated 2026-03-15
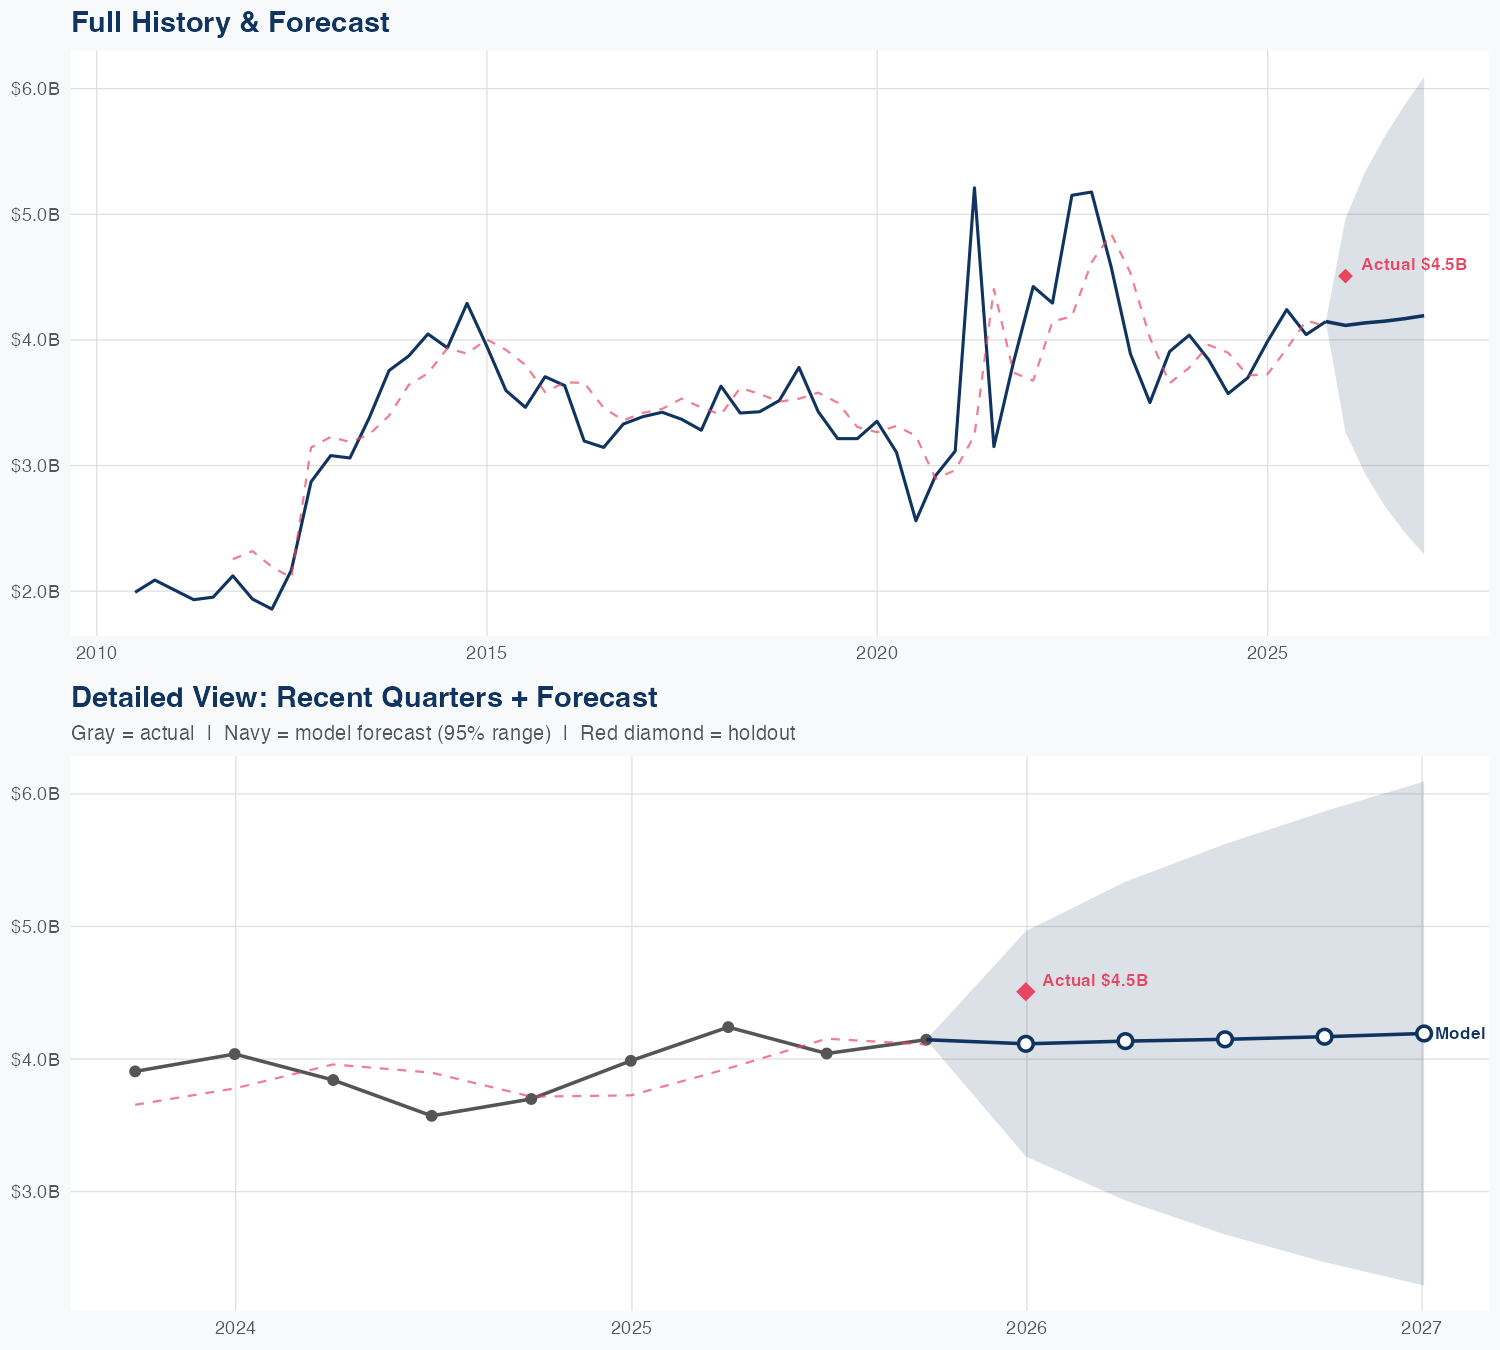
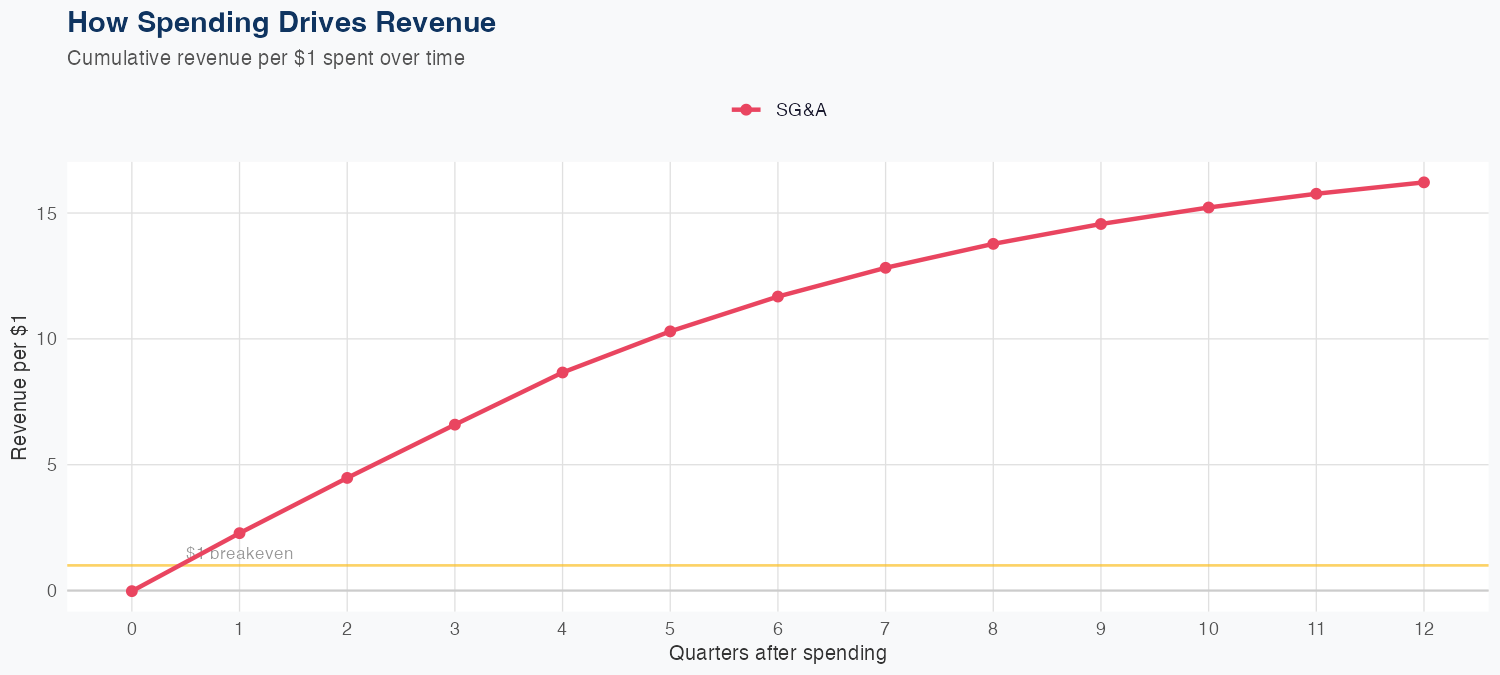
Revenue is driven by the company’s core midstream operations, with the latest quarterly revenue around $4.51 billion and a full-year forecast near $17.0 billion, down about 1.7% year over year. The SG&A spend appears highly efficient, with $1 of SG&A generating $16.22 in long-run revenue, indicating a strong ROI on operating expenditures. The forecasting uses a linear model trained on 62 quarters and shows 8.0% MAPE, with a holdout test predicting $4.10B versus $4.50B actual (about 8.7% error), signaling moderate predictive precision. Overall, the outlook remains stable: a solid revenue base and efficient cost structure support a cautious but favorable near-term trajectory despite the modest YoY decline.
Investment Thesis
The econometric model achieves strong accuracy (8.0% MAPE), suggesting Kinder Morgan, Inc.'s revenue trajectory is well-characterized by its spending patterns. Each $1 of SG&A spending generates $16.22 in revenue, reflecting strong commercial efficiency.
Revenue Forecast
Quarterly Detail
| Quarter | Model Forecast | Actual | 95% Range | YoY Growth | Status |
|---|---|---|---|---|---|
| Q4 2025 | $4.1B | $4.5B | $3.3B – $5.0B | +3.2% | ✓ In range |
| Q2 2026 | $4.1B | $2.9B – $5.3B | -2.5% | ||
| Q3 2026 | $4.1B | $2.7B – $5.6B | +2.6% | ||
| Q4 2026 | $4.2B | $2.5B – $5.9B | +0.5% | ||
| Q1 2027 | $4.2B | $2.3B – $6.1B | -7.0% |
Seasonal Factors
| Fiscal Quarter | Seasonal Factor | vs Trend | Interpretation | Obs. |
|---|---|---|---|---|
| FQ1 (Sep–Nov) | 1.0085 | +0.8% | In line with trend | 15 |
| FQ2 (Dec–Feb) | 1.0513 | +5.1% | +5.1% above trend | 15 |
| FQ3 (Mar–May) | 0.9602 | -4.0% | -4.0% below trend | 14 |
| FQ4 (Jun–Aug) | 0.9534 | -4.7% | -4.7% below trend | 14 |
How Spending Drives Revenue
Want this analysis for your portfolio?
I build custom revenue intelligence reports for investors and companies using SEC filing data, econometric modeling, and AI-powered insights.
Get in Touch