Labcorp Holdings Inc. LH
Revenue Intelligence Report • 66 quarters of SEC filing data • Updated 2026-03-16
Labcorp's revenue is forecast to grow about 16.8% year over year to roughly $19 billion, with momentum centered in core clinical testing and related services as demand accelerates. Our econometric model shows elasticities are high and rising, indicating SG&A investment is the primary growth lever and translating into outsized topline gains. Current growth attribution is roughly 36% structural/platform expansion and 64% from SG&A spend, with R&D contributing little to revenue near term. The binding constraint on growth appears to be lab capacity—the throughput and staffing needed to scale higher testing volumes. Key risk: if capacity expansion lags demand, the company could underperform the forecast, potentially pressuring utilization and margins.
Investment Thesis
At 8.3% MAPE, the model captures Labcorp Holdings Inc.'s broad revenue trajectory, though quarterly variability suggests sensitivity to external factors. Sales & marketing spend shows a 1.46x elasticity, suggesting effective go-to-market execution.
Revenue Forecast
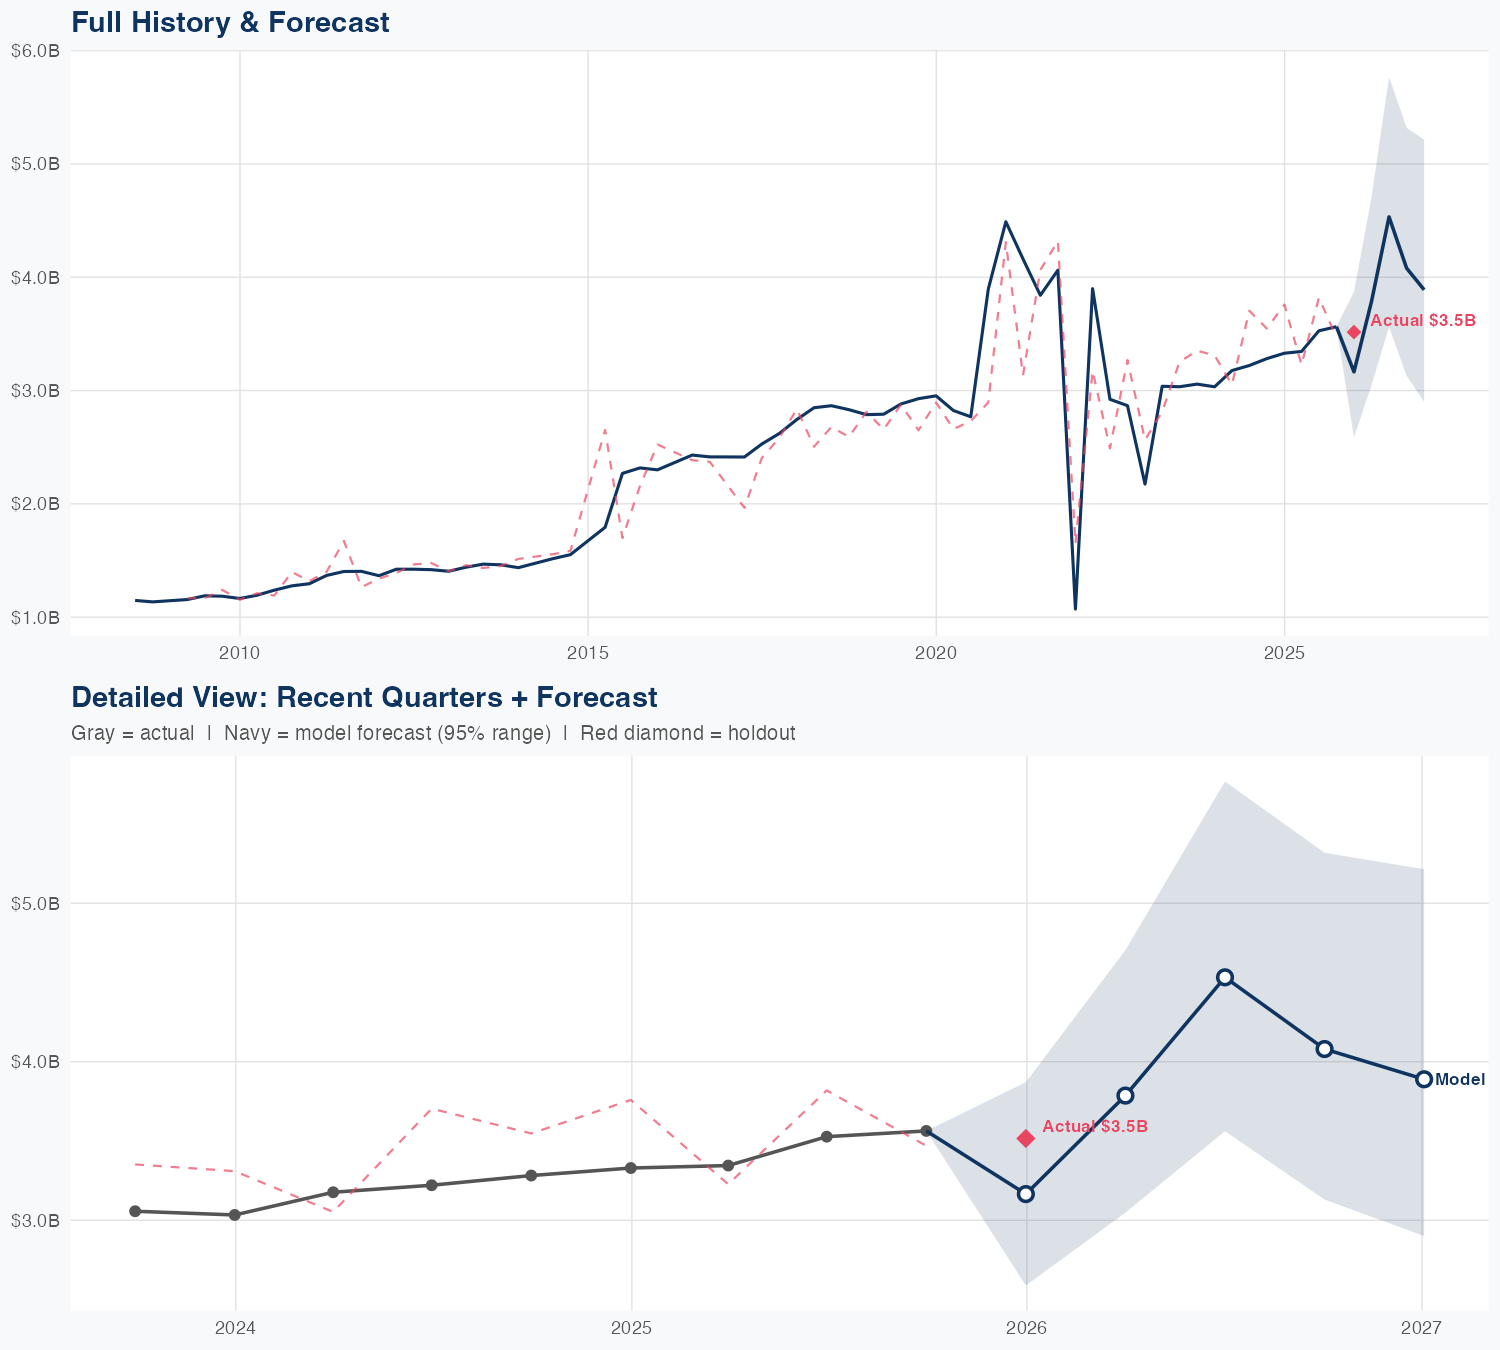
Quarterly Detail
| Quarter | Model Forecast | Actual | 95% Range | YoY Growth | Status |
|---|---|---|---|---|---|
| Q4 2025 | $3.2B | $3.5B | $2.6B – $3.9B | -4.9% | ✓ In range |
| Q2 2026 | $3.8B | $3.0B – $4.7B | +13.2% | ||
| Q3 2026 | $4.5B | $3.6B – $5.8B | +28.5% | ||
| Q4 2026 | $4.1B | $3.1B – $5.3B | +14.5% | ||
| Q1 2027 | $3.9B | $2.9B – $5.2B | +10.6% |
Seasonal Factors
| Fiscal Quarter | Seasonal Factor | vs Trend | Interpretation | Obs. |
|---|---|---|---|---|
| FQ1 (Sep–Nov) | 1.007 | +0.7% | In line with trend | 17 |
| FQ2 (Dec–Feb) | 0.9821 | -1.8% | In line with trend | 15 |
| FQ3 (Mar–May) | 1.0406 | +4.1% | +4.1% above trend | 15 |
| FQ4 (Jun–Aug) | 1.0142 | +1.4% | In line with trend | 17 |
How Spending Drives Revenue
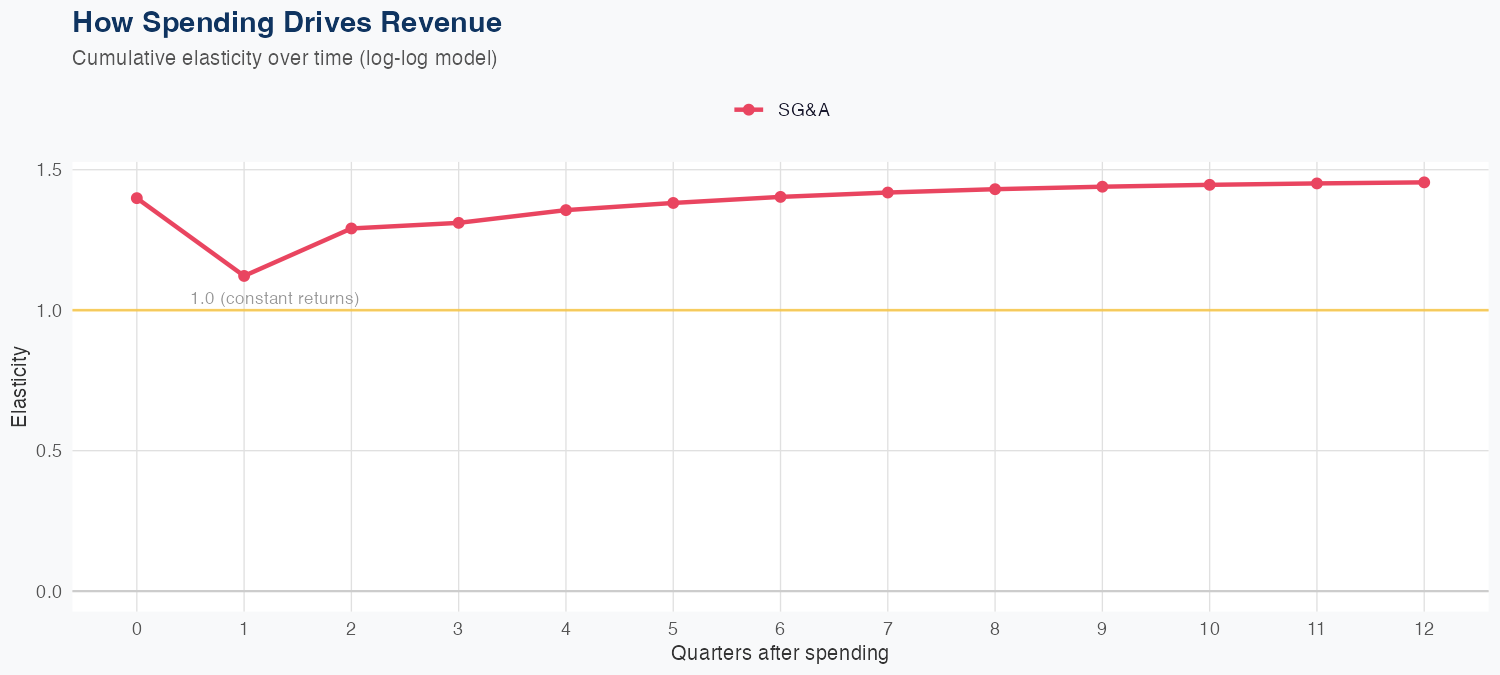
Spending Efficiency Over Time
Current SG&A elasticity: 2.5843x
Want this analysis for your portfolio?
I build custom revenue intelligence reports for investors and companies using SEC filing data, econometric modeling, and AI-powered insights.
Get in Touch