Lumentum Holdings Inc. LITE
Revenue Intelligence Report • 46 quarters of SEC filing data • Updated 2026-03-15
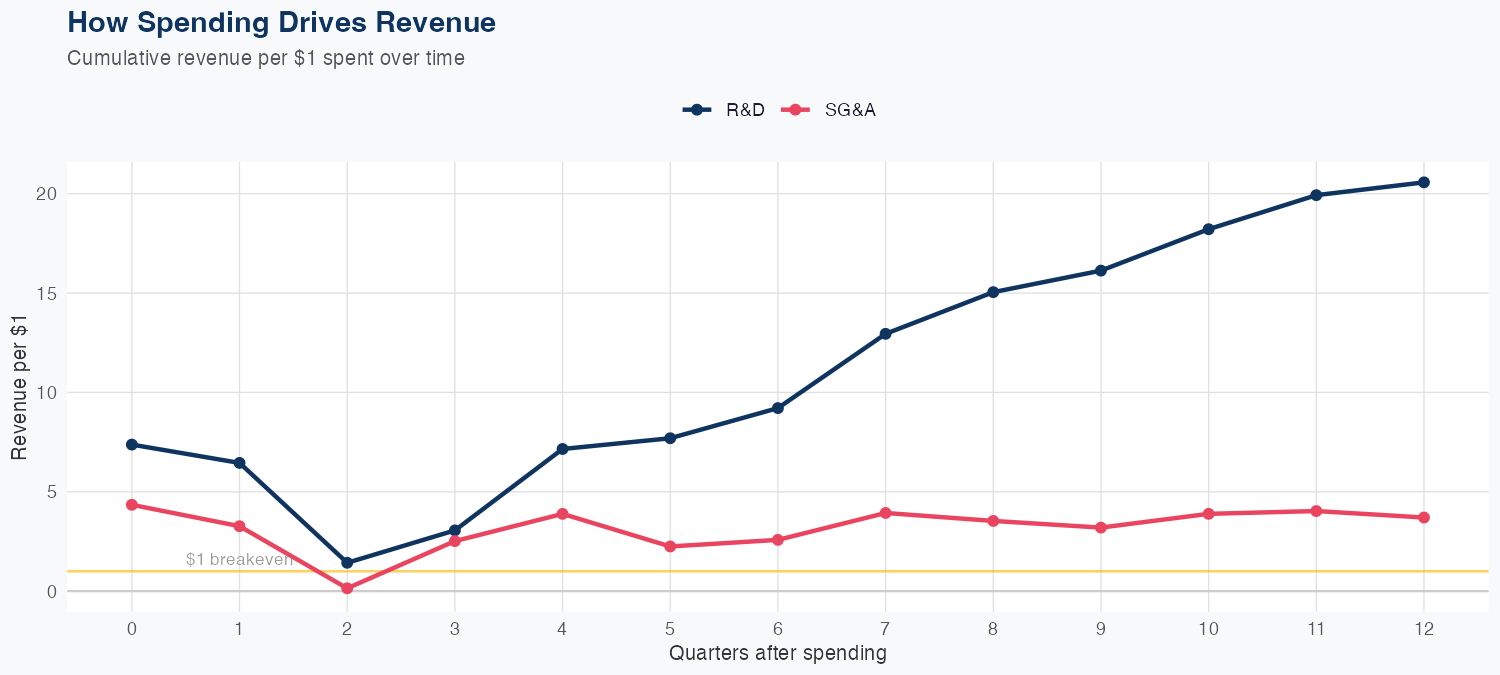
Lumentum Holdings Inc. has a forecasted full-year revenue of $2.4B, a +20.8% year-over-year change, based on 46 quarters of SEC filing data. Key revenue drivers include R&D ($20.57 per $1) and SG&A ($3.71 per $1). The ARDL model has 8.3% MAPE.
Investment Thesis
At 8.3% MAPE, the model captures Lumentum Holdings Inc.'s broad revenue trajectory, though quarterly variability suggests sensitivity to external factors. Every $1 of R&D investment is associated with $20.57 of revenue, indicating efficient capital deployment in innovation. Each $1 of SG&A spending generates $3.71 in revenue, reflecting strong commercial efficiency.
Revenue Forecast
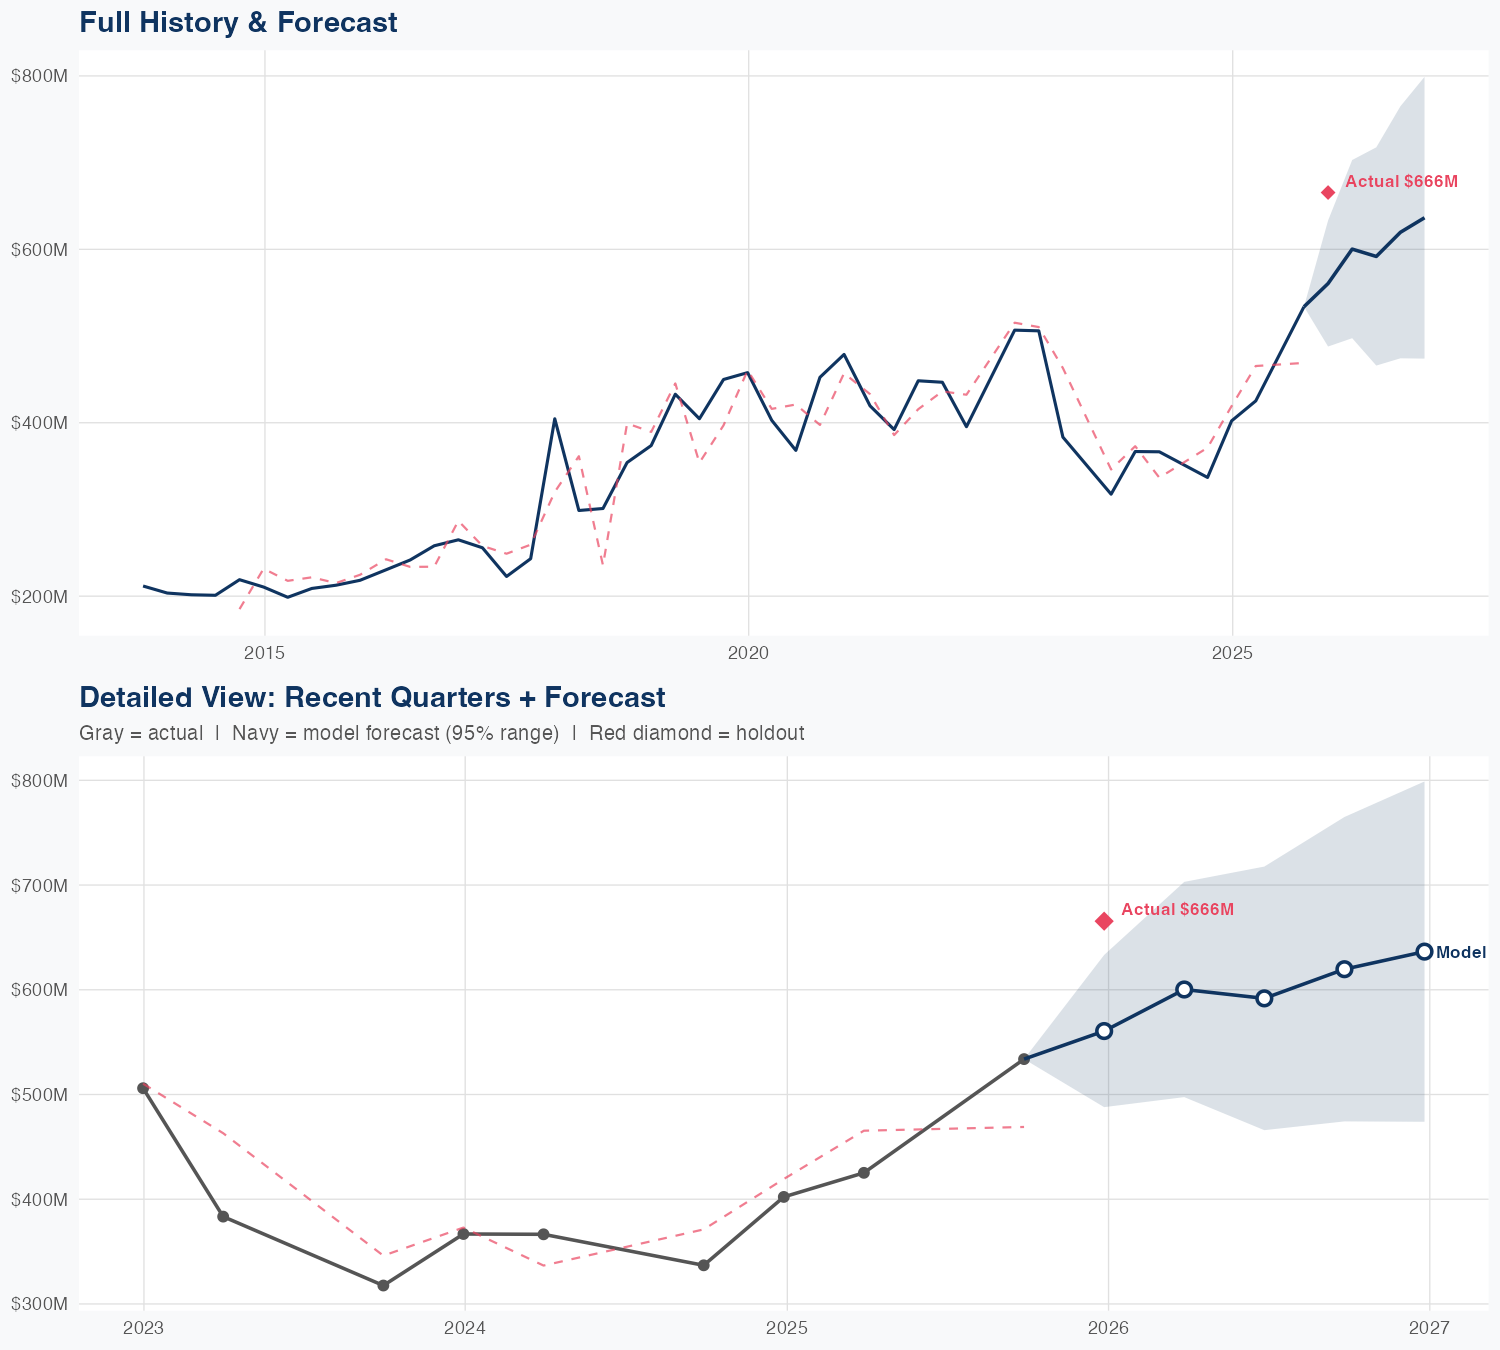
Quarterly Detail
| Quarter | Model Forecast | Actual | 95% Range | YoY Growth | Status |
|---|---|---|---|---|---|
| Q4 2025 | $561B | $666B | $488B – $633B | +66.4% | ✗ Outside range |
| Q1 2026 | $600B | $498B – $703B | +49.2% | ||
| Q2 2026 | $592B | $466B – $718B | +39.2% | ||
| Q3 2026 | $620B | $474B – $765B | +16.1% | ||
| Q4 2026 | $636B | $474B – $799B | -4.4% |
Seasonal Factors
| Fiscal Quarter | Seasonal Factor | vs Trend | Interpretation | Obs. |
|---|---|---|---|---|
| FQ1 (Sep–Nov) | 1.0789 | +7.9% | +7.9% above trend | 12 |
| FQ2 (Dec–Feb) | 0.9915 | -0.9% | In line with trend | 12 |
| FQ3 (Mar–May) | 0.9499 | -5.0% | -5.0% below trend | 11 |
| FQ4 (Jun–Aug) | 1.0164 | +1.6% | In line with trend | 7 |
How Spending Drives Revenue
Want this analysis for your portfolio?
I build custom revenue intelligence reports for investors and companies using SEC filing data, econometric modeling, and AI-powered insights.
Get in Touch