Alliant Energy Corp LNT
Revenue Intelligence Report • 66 quarters of SEC filing data • Updated 2026-03-15
Alliant Energy’s revenue is on a modest growth path, with FY revenue near $4.5 billion and a forecast of about +3.4% year over year, implying steady expansion into the next cycle. Our econometric model shows the growth engine is skewed toward SG&A spending (about 92% of the topline lift), with structural/platform growth contributing roughly 8% and R&D negligible. The SG&A multiplier has climbed from 0.74 to 0.90 over the period, indicating incremental SG&A spend is generating more topline growth than before. The binding constraint on earnings growth appears to be regulatory rate-approval backlogs and related approvals for rate-base investments, which cap the realized revenue gains from SG&A-driven initiatives. Key risk: slower-than-expected regulatory progress or rate-case outcomes could throttle the topline despite improving SG&A efficiency.
Investment Thesis
Our ARDL model tracks Alliant Energy Corp's revenue with exceptional precision (3.0% MAPE), indicating highly predictable cash flows. Each $1 of SG&A spending generates $1.74 in revenue, reflecting strong commercial efficiency.
Revenue Forecast
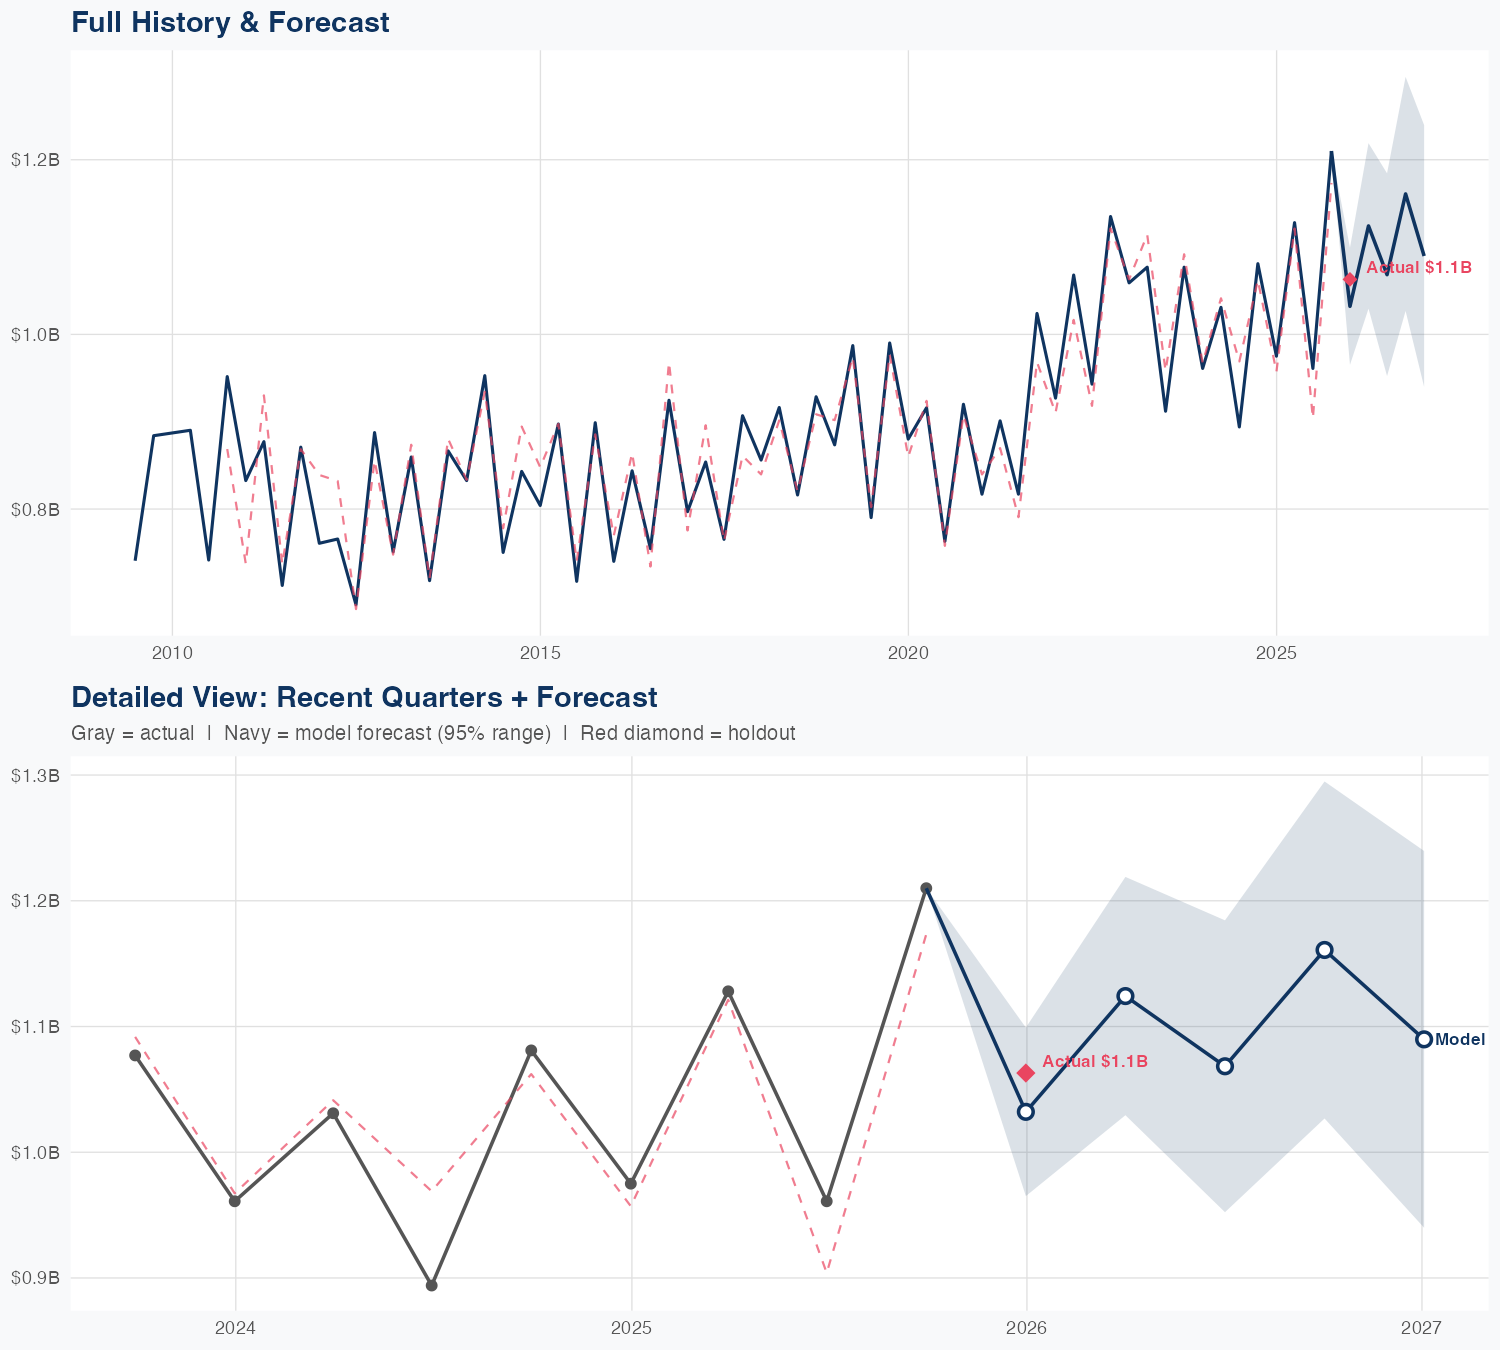
Quarterly Detail
| Quarter | Model Forecast | Actual | 95% Range | YoY Growth | Status |
|---|---|---|---|---|---|
| Q4 2025 | $1.1B | $1.1B | $1.0B – $1.3B | +15.5% | ✓ In range |
| Q2 2026 | $1.2B | $1.0B – $1.3B | +3.6% | ||
| Q3 2026 | $1.0B | $0.9B – $1.1B | +4.9% | ||
| Q4 2026 | $1.2B | $1.0B – $1.3B | -4.0% | ||
| Q1 2027 | $1.2B | $1.0B – $1.4B | +10.3% |
Seasonal Factors
| Fiscal Quarter | Seasonal Factor | vs Trend | Interpretation | Obs. |
|---|---|---|---|---|
| FQ1 (Sep–Nov) | 1.0151 | +1.5% | In line with trend | 16 |
| FQ2 (Dec–Feb) | 0.999 | -0.1% | In line with trend | 16 |
| FQ3 (Mar–May) | 0.9914 | -0.9% | In line with trend | 15 |
| FQ4 (Jun–Aug) | 0.9964 | -0.4% | In line with trend | 15 |
How Spending Drives Revenue
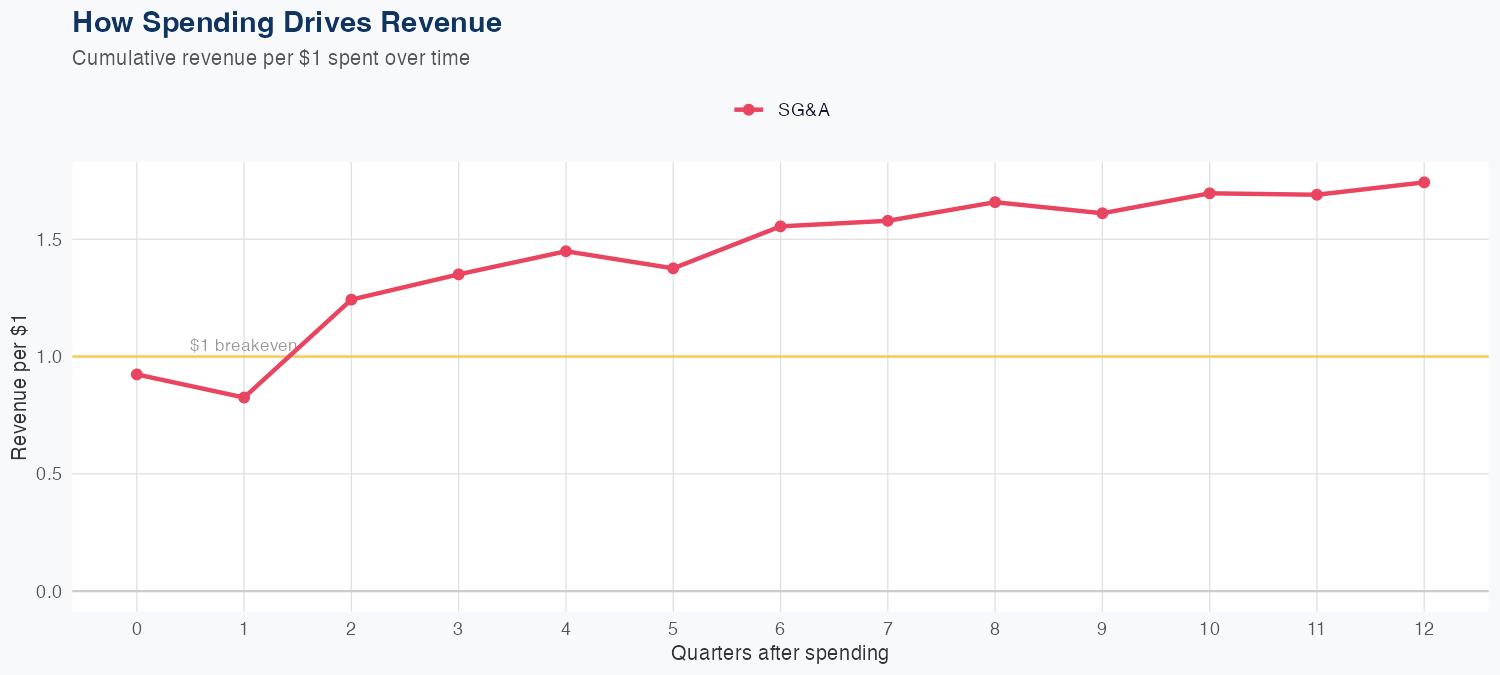
Spending Efficiency Over Time
Current SG&A multiplier: 0.9016
Want this analysis for your portfolio?
I build custom revenue intelligence reports for investors and companies using SEC filing data, econometric modeling, and AI-powered insights.
Get in Touch