Lpl Financial Holdings Inc. LPLA
Revenue Intelligence Report • 62 quarters of SEC filing data • Updated 2026-03-15
We expect LPL Financial’s revenue to grow about 44% year over year to roughly $35.4 billion, as the business benefits from structural platform growth and pricing power. The binding constraint on growth is the company’s capacity to recruit and onboard additional financial advisers and scale the platform to support a larger network. Our econometric model shows roughly 62% of the revenue growth is structural/platform-driven, with the remainder tied to SG&A investments. The time-varying data imply operating leverage is improving, so growth hinges on platform scale rather than incremental spending. Key risk: a slower pace of adviser recruitment or higher churn could cap asset growth and recurring revenue despite a large total addressable market.
Investment Thesis
Our ARDL model tracks Lpl Financial Holdings Inc.'s revenue with exceptional precision (2.2% MAPE), indicating highly predictable cash flows. Sales & marketing spend shows a 1.14x elasticity, suggesting effective go-to-market execution.
Revenue Forecast
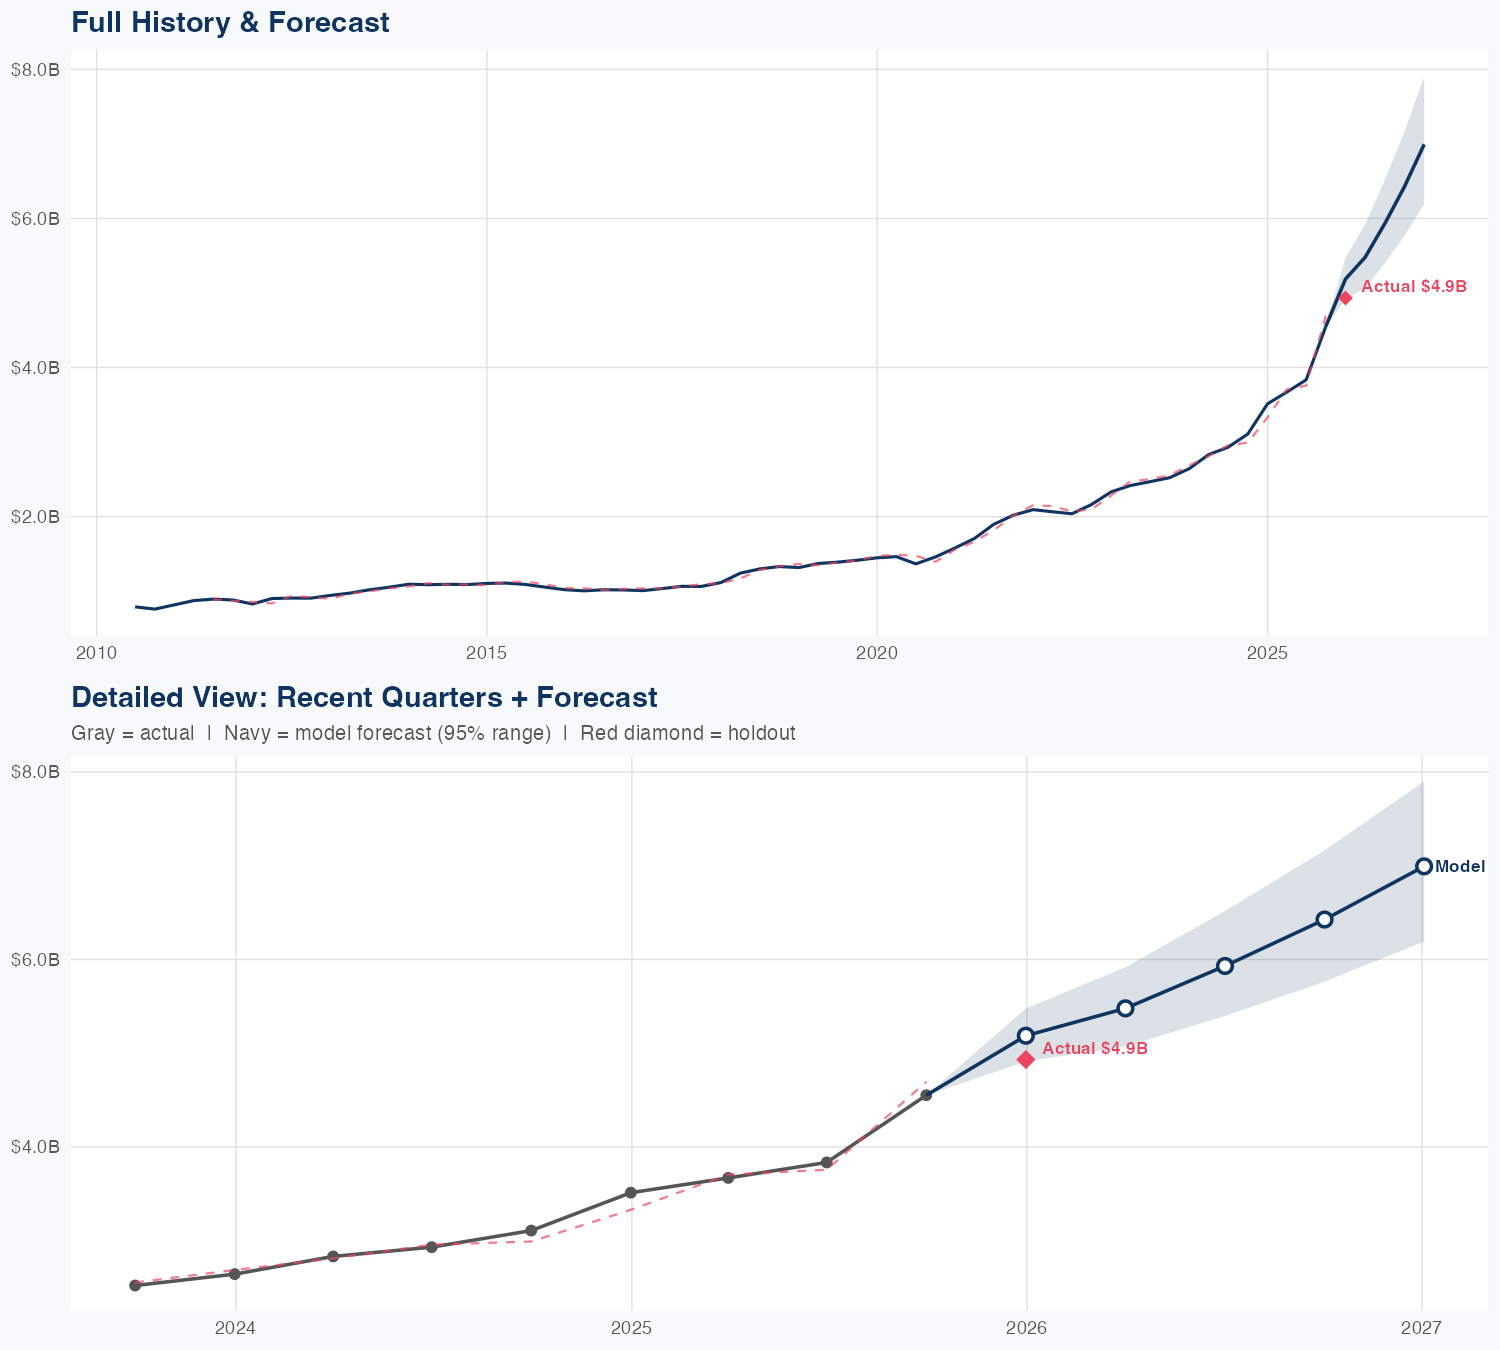
Quarterly Detail
| Quarter | Model Forecast | Actual | 95% Range | YoY Growth | Status |
|---|---|---|---|---|---|
| Q4 2025 | $5.2B | $4.9B | $4.9B – $5.5B | +47.9% | ✓ In range |
| Q2 2026 | $5.3B | $4.9B – $5.7B | +43.9% | ||
| Q3 2026 | $5.4B | $4.9B – $5.9B | +40.9% | ||
| Q4 2026 | $6.6B | $5.9B – $7.4B | +45.7% | ||
| Q1 2027 | $7.2B | $6.4B – $8.1B | +46.0% |
Seasonal Factors
| Fiscal Quarter | Seasonal Factor | vs Trend | Interpretation | Obs. |
|---|---|---|---|---|
| FQ1 (Sep–Nov) | 0.9991 | -0.1% | In line with trend | 15 |
| FQ2 (Dec–Feb) | 1.0065 | +0.7% | In line with trend | 15 |
| FQ3 (Mar–May) | 0.9975 | -0.3% | In line with trend | 14 |
| FQ4 (Jun–Aug) | 1.0035 | +0.3% | In line with trend | 15 |
How Spending Drives Revenue
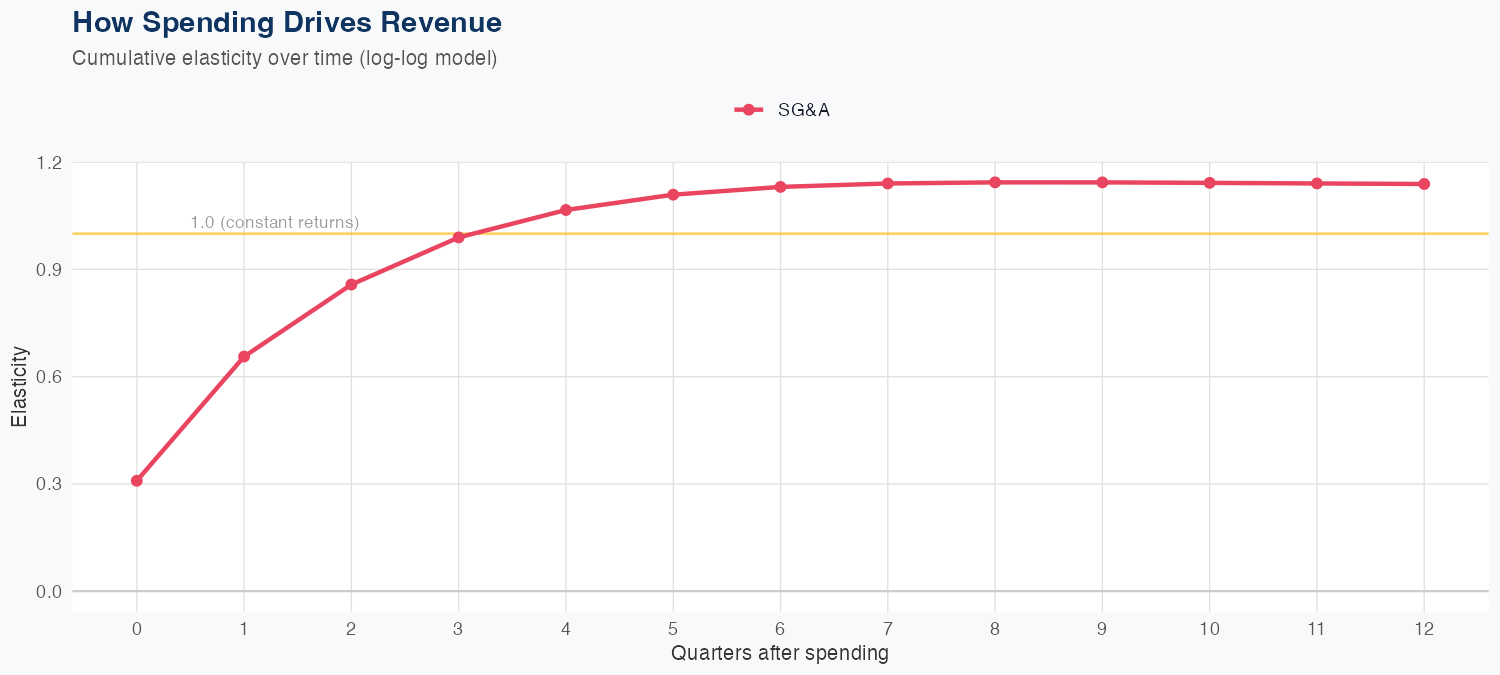
Spending Efficiency Over Time
Current SG&A elasticity: 0.2137x
Want this analysis for your portfolio?
I build custom revenue intelligence reports for investors and companies using SEC filing data, econometric modeling, and AI-powered insights.
Get in Touch