Mid-America Apartment Communities, Inc. MAA
Revenue Intelligence Report • 48 quarters of SEC filing data • Updated 2026-03-15
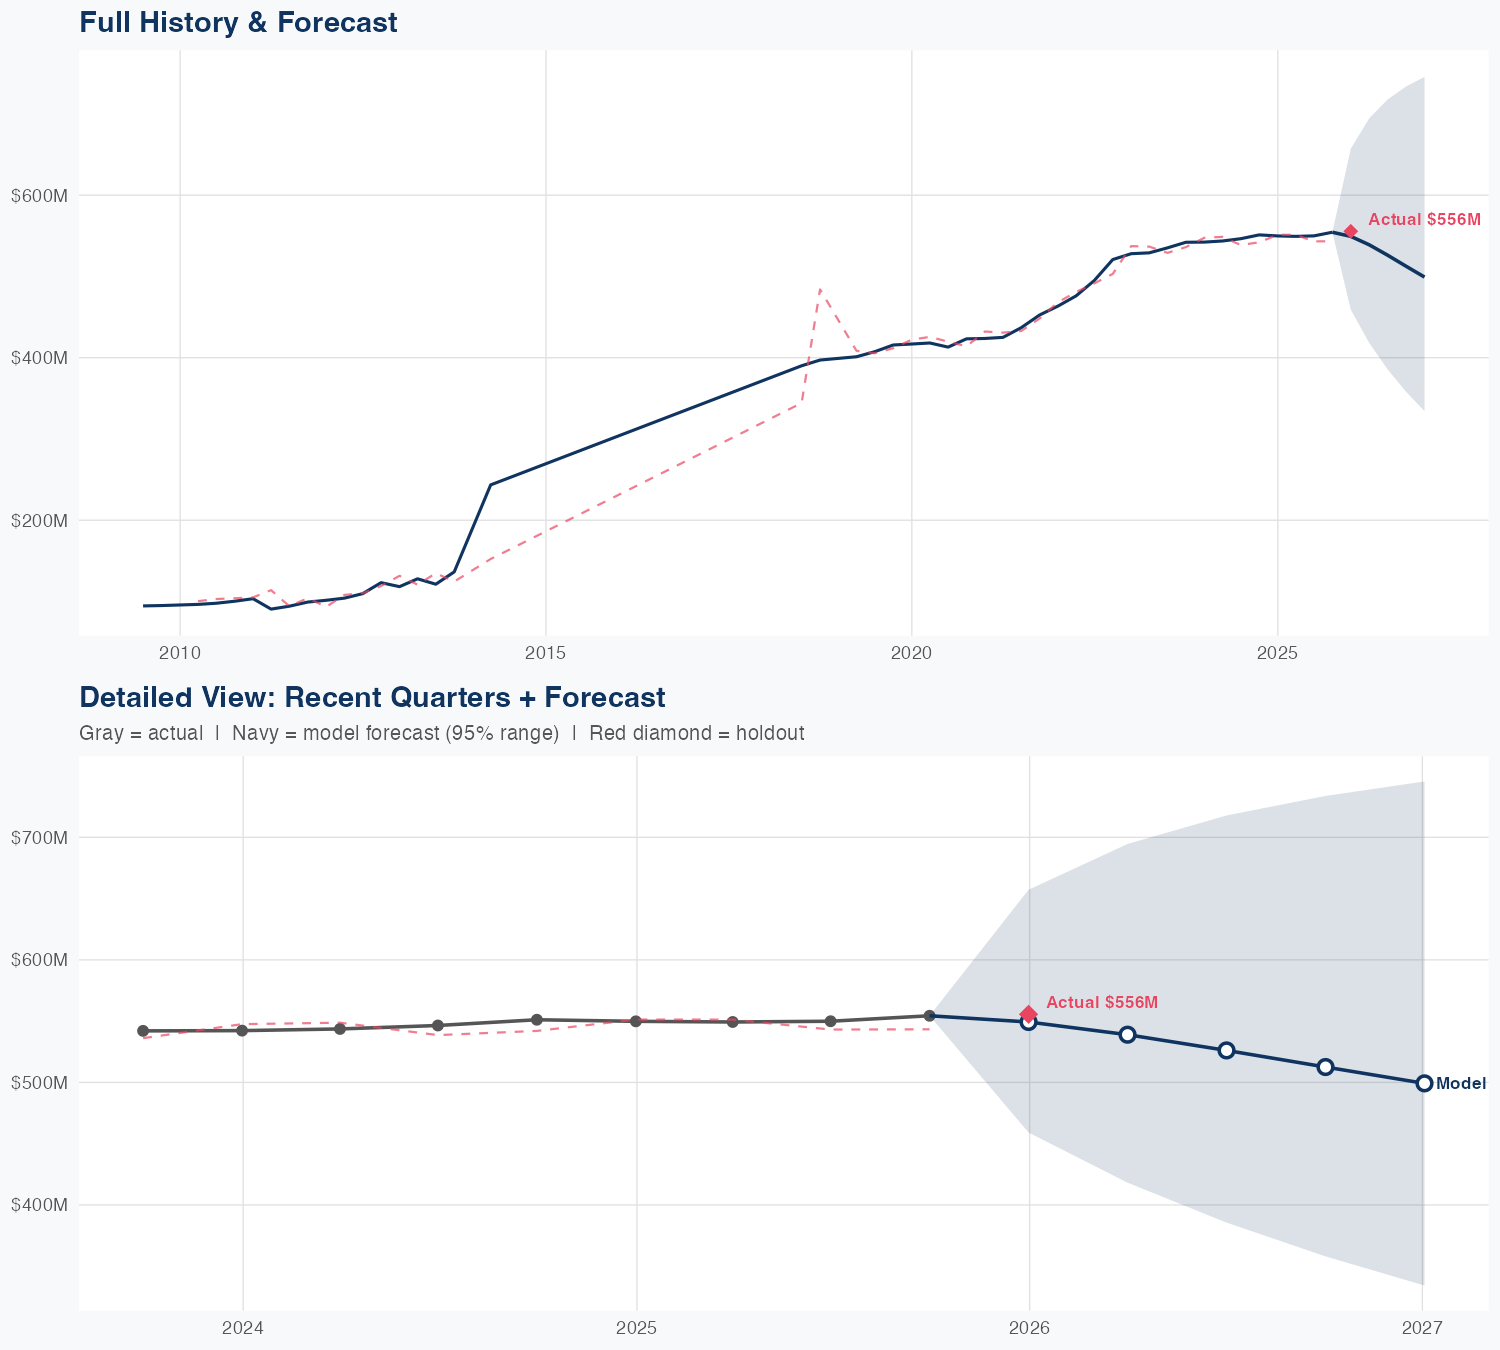
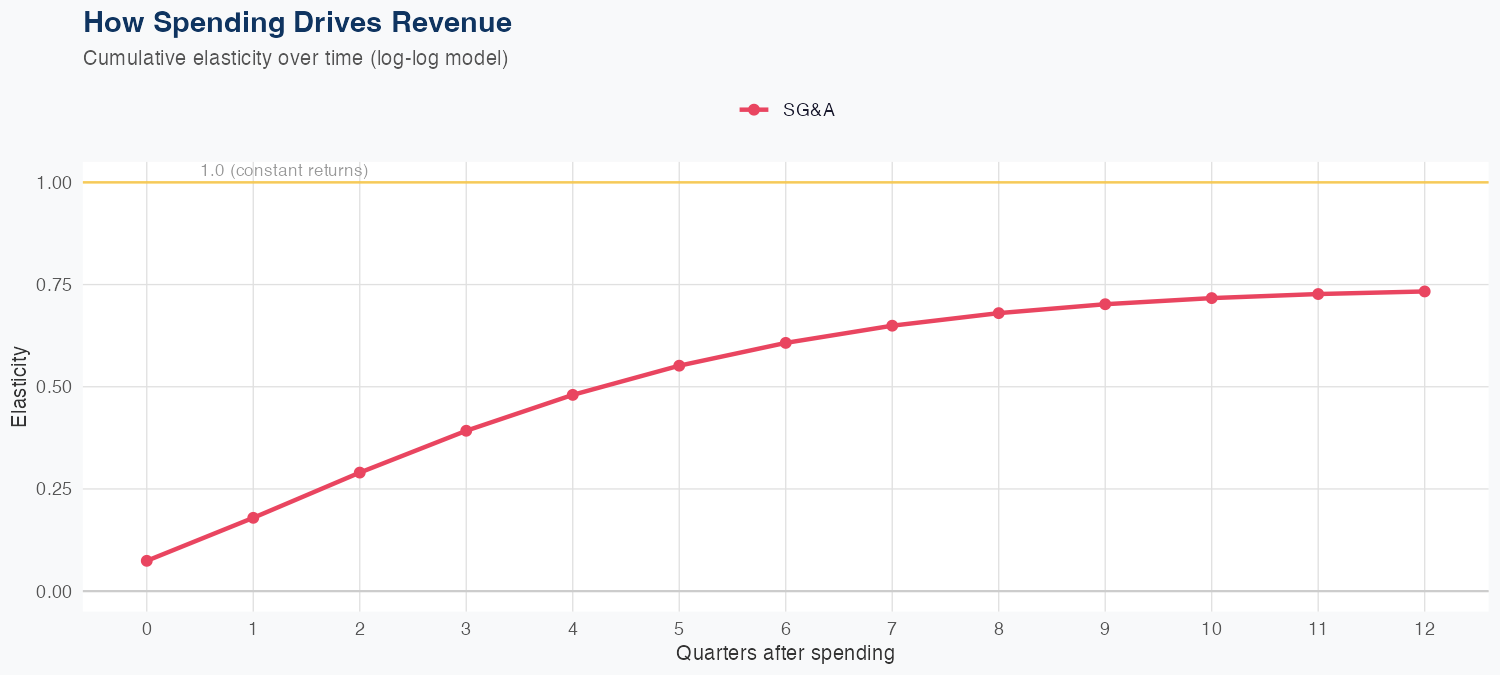
Latest quarterly revenue stood at $556M, with SG&A spending showing an elasticity of 0.73 (a 1% SG&A increase yields a 0.73% revenue rise), signaling a positive but moderate ROI on operating expenditures. The model uses a log-log specification and reports 4.5% MAPE, with holdout accuracy of 1.1% (actual $556M vs predicted $549M), underscoring forecast credibility. The full-year revenue forecast is $2,077M, down 6.0% year over year, indicating near-term top-line pressure. With 48 quarters of history, the framework provides a robust planning baseline, and the outlook suggests revenue can be supported by disciplined SG&A investment and cost management despite macro headwinds.
Investment Thesis
The econometric model achieves strong accuracy (4.5% MAPE), suggesting Mid-America Apartment Communities, Inc.'s revenue trajectory is well-characterized by its spending patterns. Sales & marketing spend shows a 0.73x elasticity, suggesting effective go-to-market execution.
Revenue Forecast
Quarterly Detail
| Quarter | Model Forecast | Actual | 95% Range | YoY Growth | Status |
|---|---|---|---|---|---|
| Q4 2025 | $549B | $556B | $459B – $657B | -0.1% | ✓ In range |
| Q2 2026 | $539B | $418B – $695B | -1.9% | ||
| Q3 2026 | $526B | $386B – $718B | -4.3% | ||
| Q4 2026 | $513B | $358B – $734B | -7.5% | ||
| Q1 2027 | $499B | $334B – $746B | -10.1% |
Seasonal Factors
| Fiscal Quarter | Seasonal Factor | vs Trend | Interpretation | Obs. |
|---|---|---|---|---|
| FQ1 (Sep–Nov) | 1.0168 | +1.7% | In line with trend | 12 |
| FQ2 (Dec–Feb) | 0.99 | -1.0% | In line with trend | 10 |
| FQ3 (Mar–May) | 0.9864 | -1.4% | In line with trend | 12 |
| FQ4 (Jun–Aug) | 1.0072 | +0.7% | In line with trend | 12 |
How Spending Drives Revenue
Want this analysis for your portfolio?
I build custom revenue intelligence reports for investors and companies using SEC filing data, econometric modeling, and AI-powered insights.
Get in Touch