Mongodb, Inc. MDB
Revenue Intelligence Report • 37 quarters of SEC filing data • Updated 2026-03-15
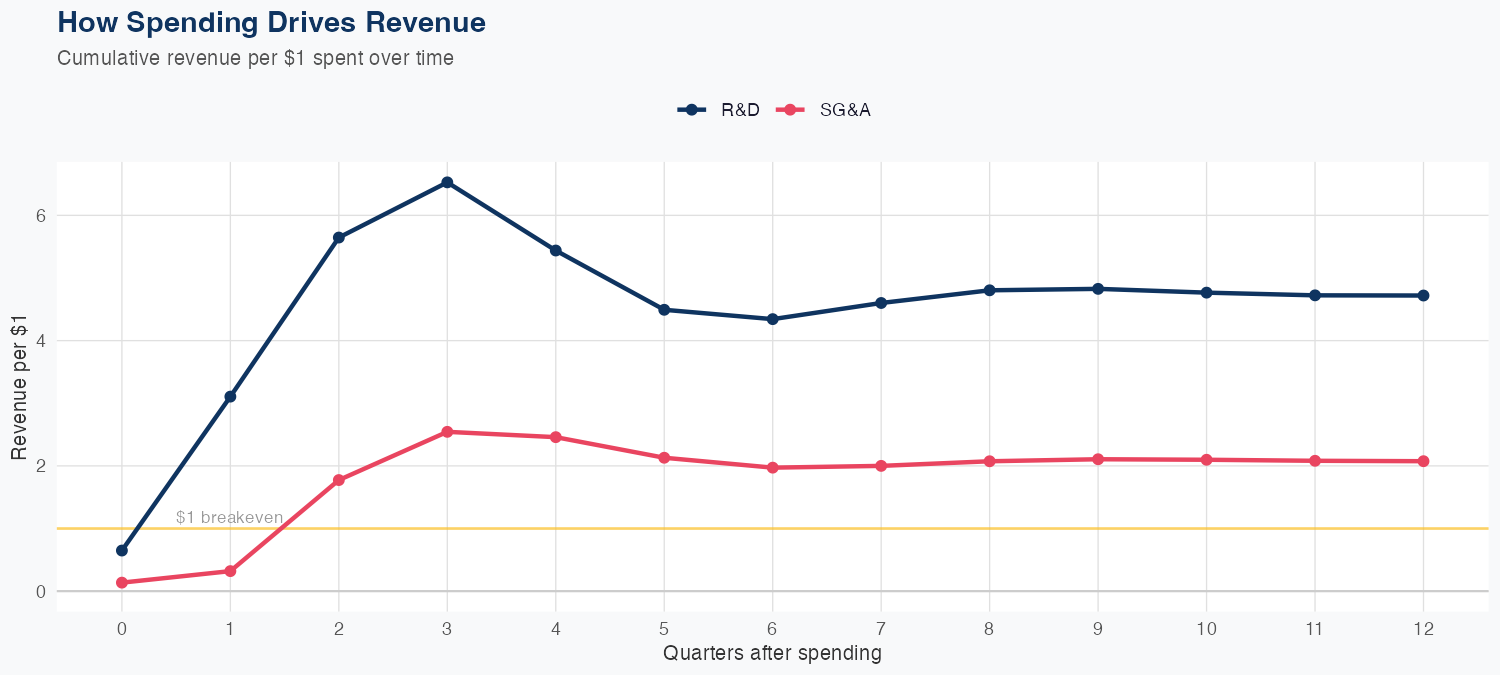
Revenue is driven primarily by R&D investments, with the model estimating $4.72 of long-run revenue generated per $1 of R&D spending, followed by SG&A at $2.07 per $1. The linear model, trained on 37 quarters of data, delivers solid predictive accuracy (2.7% MAPE) with a holdout test error of about 2.0% (predicted $681M vs actual $695M). Quarterly revenue reached $695M, aligning with the ROI-driven spending trajectory and supporting the efficiency of the current mix. The FY revenue forecast is $2.84B, up 15.3% year over year, signaling a healthy growth outlook under the observed ROI dynamics.
Investment Thesis
Our ARDL model tracks Mongodb, Inc.'s revenue with exceptional precision (2.7% MAPE), indicating highly predictable cash flows. Every $1 of R&D investment is associated with $4.72 of revenue, indicating efficient capital deployment in innovation. Each $1 of SG&A spending generates $2.07 in revenue, reflecting strong commercial efficiency.
Revenue Forecast
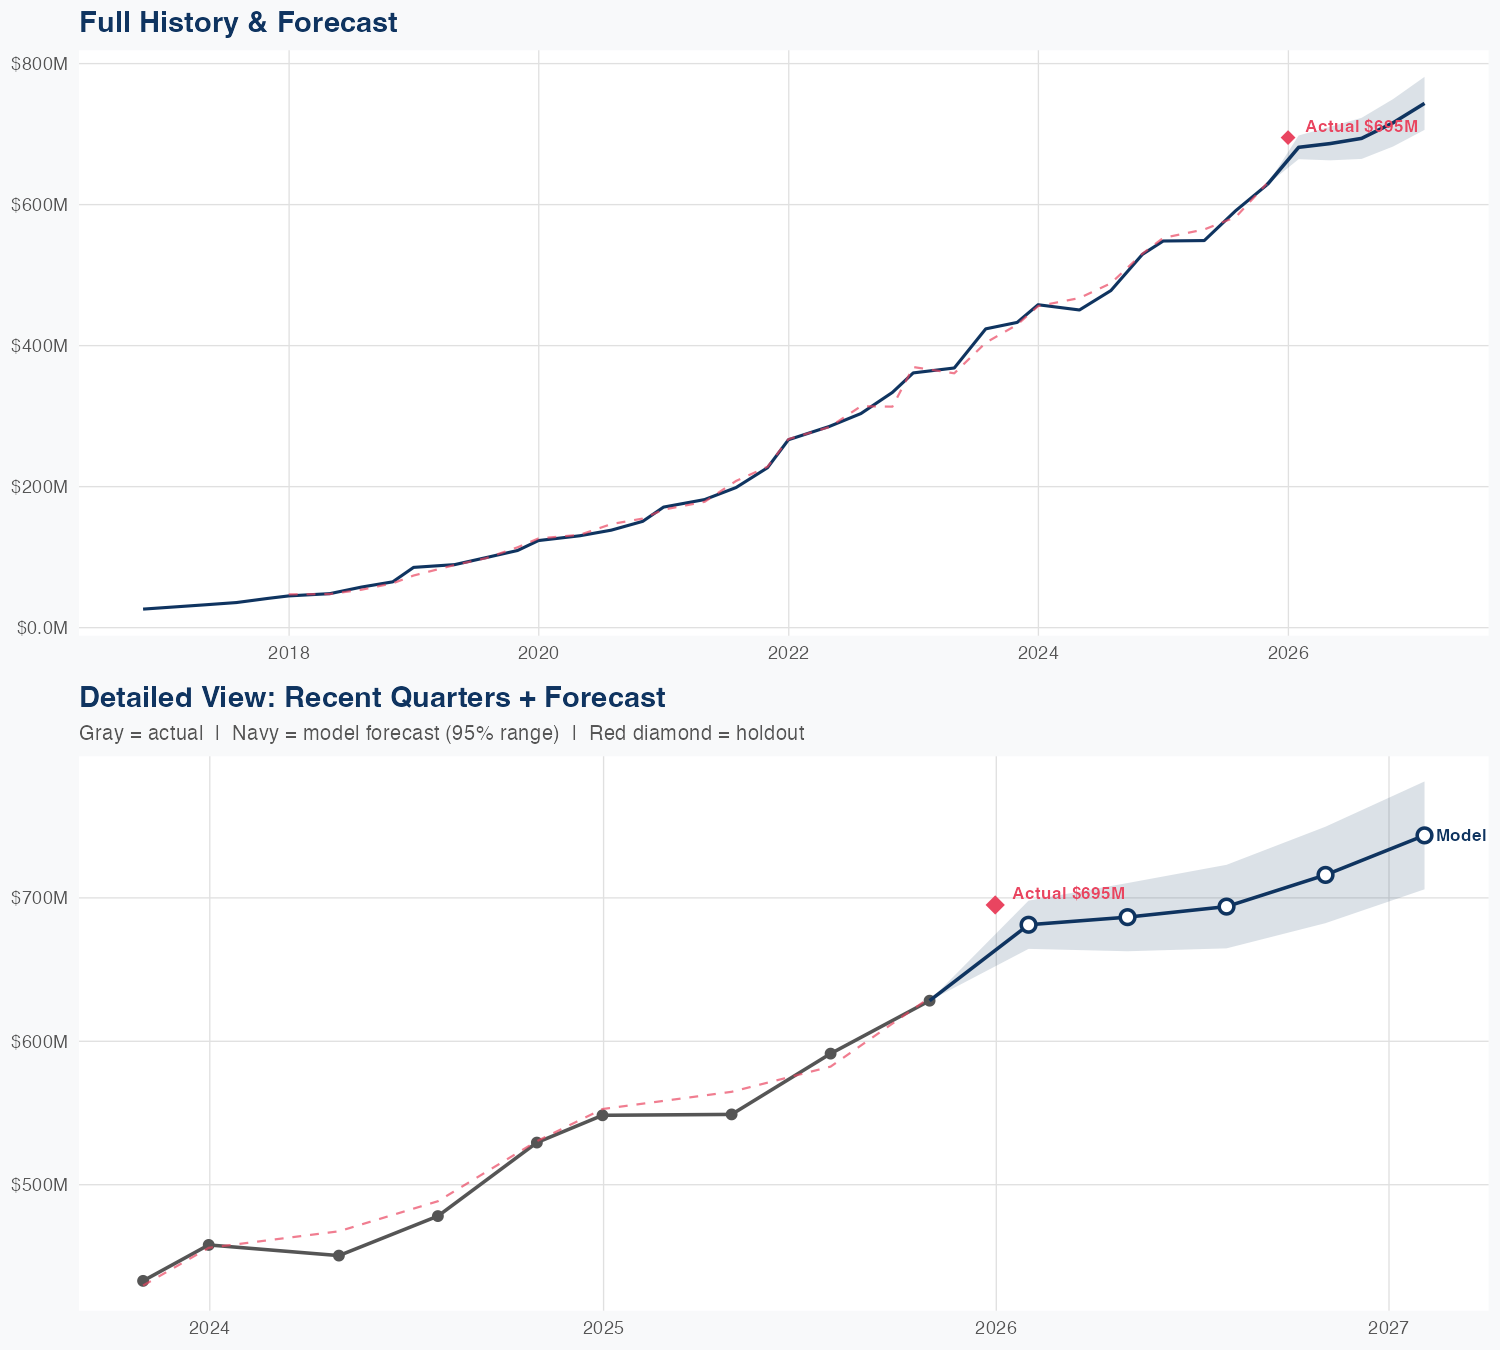
Quarterly Detail
| Quarter | Model Forecast | Actual | 95% Range | YoY Growth | Status |
|---|---|---|---|---|---|
| Q1 2026 | $681B | $695B | $664B – $698B | +24.2% | ✓ In range |
| Q2 2026 | $687B | $663B – $710B | +25.1% | ||
| Q3 2026 | $694B | $665B – $723B | +17.3% | ||
| Q4 2026 | $716B | $682B – $750B | +14.0% | ||
| Q1 2027 | $744B | $706B – $781B | +7.0% |
Seasonal Factors
| Fiscal Quarter | Seasonal Factor | vs Trend | Interpretation | Obs. |
|---|---|---|---|---|
| FQ1 (Sep–Nov) | 0.9982 | -0.2% | In line with trend | 8 |
| FQ2 (Dec–Feb) | 0.9966 | -0.3% | In line with trend | 9 |
| FQ3 (Mar–May) | 1.0063 | +0.6% | In line with trend | 8 |
| FQ4 (Jun–Aug) | 1.0083 | +0.8% | In line with trend | 8 |
How Spending Drives Revenue
Want this analysis for your portfolio?
I build custom revenue intelligence reports for investors and companies using SEC filing data, econometric modeling, and AI-powered insights.
Get in Touch